Graphing and sketching logarithmic functions: a step by step tutorial. The properties such as domain, range, vertical asymptotes and intercepts of the graphs of these functions are also examined in details. Free graph paper is available.
a - The domain of \( f \) is the set of all x values such that \[ x + 2 > 0 \] Solving the above inequality gives the domain: \[ x > -2 \] The range of \( f \) is given by the interval \[ (-\infty, +\infty) \]
b - The vertical asymptote is obtained by solving the equation: \[ x + 2 = 0 \] which gives \[ x = -2 \] As \( x \) approaches -2 from the right \( x \to -2^+ \) (that is, \( x > -2 \)), the function \( f(x) \) decreases without bound because there is a vertical asymptote. How do we know this?
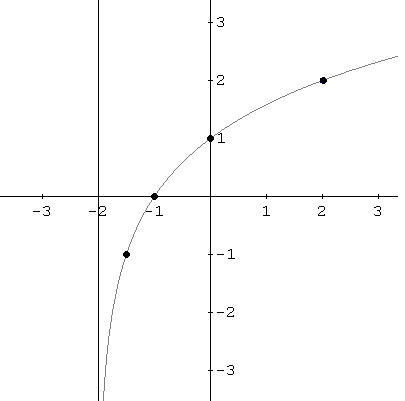
Let us calculate values of \( f(x) \) as \( x \) approaches \(-2\) from the right (\( x > -2 \)): \[ f(-1) = \log_2(-1 + 2) = \log_2(1) = 0 \] \[ f(-1.5) = \log_2(-1.5 + 2) = \log_2\left(\frac{1}{2}\right) = -1 \] \[ f(-1.99) = \log_2(-1.99 + 2) = \log_2(0.01) \approx -6.64 \] \[ f(-1.999999) = \log_2(-1.999999 + 2) = \log_2(0.000001) \approx -19.93 \] As we continue with values of \( x \) closer and closer to \(-2\), the values of \( f(x) \) decrease without bound: \[ \lim_{x \to -2^+} f(x) = -\infty \]
c - To find the \( x \)-intercept, we need to solve the equation \( f(x) = 0 \), or \[ \log_2(x + 2) = 0 \] Rewrite the above equation in exponential form: \[ x + 2 = 2^0 \] Then simplify and solve for \( x \): \[ x + 2 = 1 \] \[ x = -1 \] The \( x \)-intercept is at the point \( (-1, 0) \). The \( y \)-intercept is at the point \( (0, f(0)) \): \[ f(0) = \log_2(0 + 2) = \log_2(2) = 1 \] So the \( y \)-intercept is \( (0, 1) \).
d - So far we have the domain, range, \( x \)- and \( y \)-intercepts, and the vertical asymptote. We need more points.
Let us consider a point at \( x = -\frac{3}{2} \) (halfway between the \( x \)-intercept and the vertical asymptote), and another point at \( x = 2 \).
\[
f\left(-\frac{3}{2}\right) = \log_2\left(-\frac{3}{2} + 2\right) = \log_2\left(\frac{1}{2}\right) = \log_2\left(2^{-1}\right) = -1
\]
\[
f(2) = \log_2(2 + 2) = \log_2(4) = \log_2(2^2) = 2
\]
We now have more information on how to graph \( f \). The graph increases as \( x \) increases. Close to the vertical asymptote \( x = -2 \), the graph of \( f \) decreases without bound as \( x \) approaches \(-2\) from the right. The graph never intersects the vertical asymptote.
We now join the different points with a smooth curve.

b - The vertical asymptote is obtained by solving the equation \[ x - 4 = 0 \] Solve \[ x = 4 \] As \( x \) approaches \( 4 \) from the right \( (x \gt 4) \) , \( f(x) \) increases without bound. How do we know this?
Let us take some values: \[ f(5) = -3 \ln(5-4) = -3 ln(1) = 0 \] \[ f(4.001) = -3 \ln(0.001) \approx 20.72 \] \[ f(4.000001) = - 3 \ln(0.000001) \approx 41.45 \].
c - To find the x intercept we need to solve the equation \( f(x) = 0 \) or \[ - 3 \ln (x - 4) = 0 \] Divide both sides by \( -3 \) to obtain \[ \ln(x - 4) = 0 \] Rewrite the above equation in exponential form \[ (x - 4) = e^0 \] Then simplify and solve for \( x \): \[ x - 4 = 1 \] \[ x = 5 \] The x intercept is at the point \[ (5 , 0) \] The y intercept is at the point \( (0 , f(0)) \). But \( f(0) \) is undefined since \( x = 0 \) is not a value in the domain of \( f \). Therefore there no y intercept.
d - So far we have the domain, range, x-intercept, and the vertical asymptote. We need extra points to be able to graph \( f \).
\begin{align*}
f(4.5) &= -3\ln(4.5 - 4) \approx 2.08 \\\\
f(8) &= -3\ln(8 - 4) \approx -4.16 \\\\
f(14) &= -3\ln(14 - 4) \approx -6.91
\end{align*}
Let us now sketch all the points and the vertical asymptote. Join the points by a smooth curve and \( f \) increases as \( x \) approaches \( 4 \) from the right.

The range of \( f \) is the interval \[ (-\infty, +\infty) \].
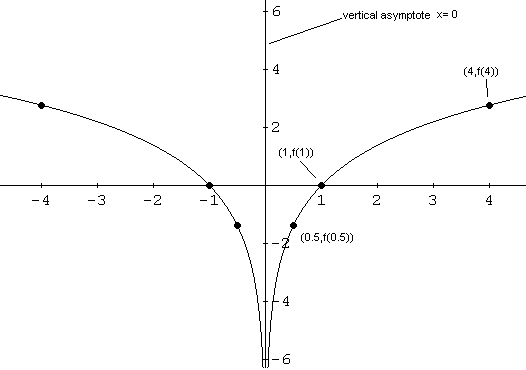
b - The vertical asymptote is obtained by solving \( |x| = 0 \) which gives \[ x = 0 \] As \( x \) approaches 0 from the right (\( x > 0 \)), \( f(x) \) decreases without bound. How do we know this?
Let us take some values: \[ f(1) = 2 \ln(|1|) = 0 \] \[ f(0.1) = 2 \ln(0.1) \approx -4.61 \] \[ f(0.0001) = 2 \ln(0.0001) \approx -18.42 \] \[ f(0.0000001) = 2 \ln(0.0000001) \approx -32.24 \] As \( x \) approaches 0 from the left (\( x < 0 \)), \( f(x) \) decreases without bound. How do we know this?
Let us take some values: \[ f(-1) = 2 \ln(|-1|) = 0 \] \[ f(-0.1) = 2 \ln(|-0.1|) \approx -4.61 \] \[ f(-0.0001) = 2 \ln(|-0.0001|) \approx -18.42 \] \[ f(-0.0000001) = 2 \ln(|-0.0000001|) \approx -32.24 \] c - To find the \( x \)-intercept, we need to solve the equation \( f(x) = 0 \) or \( 2 \ln(|x|) = 0 \). Divide both sides by 2 to obtain: \[ \ln(|x|) = 0 \] Rewrite the above equation in exponential form: \[ |x| = e^0 \] Then simplify: \[ |x| = 1 \] The solutions to the above equation are \( x = -1 \) and \( x = 1 \). Hence, there are two \( x \)-intercepts at \( (1, 0) \) and \( (-1, 0) \).
The \( y \)-intercept is given by \( (0, f(0)) \). \( f(0) \) is undefined since \( x = 0 \) is not a value in the domain of \( f \). There is no \( y \)-intercept.
So far, we have the domain, range, \( x \)-intercept, and the vertical asymptote.
By examining function \( f \), it is easy to show that this is an even function and its graph is symmetric with respect to the \( y \)-axis. Why?
\[ f(-x) = 2 \ln(|-x|) = 2 \ln(|x|) = f(x) \]
We now find extra points.
\[ f(4) = 2 \ln(|4|) \approx 2.77 \]
\[ f(0.5) = 2 \ln(|0.5|) \approx -1.39 \]
Since \( f \) is even, \( f(-4) = f(4) \) and \( f(-0.5) = f(0.5) \).
Let us now plot all the points, the vertical asymptote, and join the points by a smooth curve.
