How to graph a rational function? A step by step tutorial. The properties such as domain, vertical and horizontal asymptotes of a rational function are also investigated. Free graph paper is available.
A rational function f has the form \[ f(x) = \dfrac{g(x)}{h(x)} \] where \( g (x) \) and \( h (x) \) are polynomial functions.
The domain of \( f \) is the set of all real numbers except the values of \( x \) that make the denominator \( h (x) \) equal to zero.
In what follows, we assume that \( g (x) \) and \( h (x) \) have no common factors.
let us evaluate function \( f \) at values of \( x \) close to \( 3 \) such that \( x \lt 3 \). The values are shown in the table below: \[ \begin{array}{|c|c|c|c|c|c|c|c|c|} \hline x & 1 & 2 & 2.5 & 2.8 & 2.9 & 2.99 & 2.999 & 2.99999 \\ \hline f(x) & -1 & -2 & -4 & -10 & -20 & -200 & -2000 & -2 \times 10^5 \\ \hline \end{array} \] Let us now evaluate \( f \) at values of \( x \) close to 3 such that \( x \gt 3\). \[ \begin{array}{|c|c|c|c|c|c|c|c|c|} \hline x & 5 & 4 & 3.5 & 3.2 & 3.1 & 3.01 & 3.001 & 3.00001 \\ \hline f(x) & 1 & 2 & 4 & 10 & 20 & 200 & 2000 & 2 \times 10^5 \\ \hline \end{array} \]
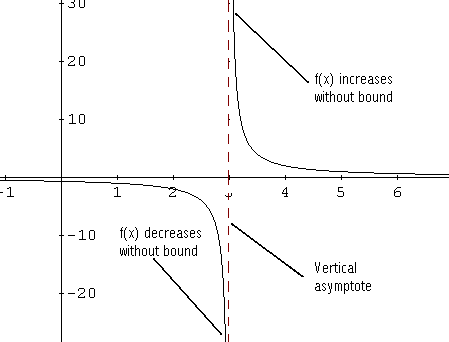
The graph of \( f \) is shown below.

1) As \( x \) approaches 3 from the left or by values smaller than 3, \( f (x) \) decreases without bound.
2) As \( x \) approaches 3 from the right or by values larger than 3, \( f (x) \) increases without bound. We say that the line \( x = 3 \), broken line, is the vertical asymptote for the graph of \( f \). In general, the line \( x = a \) is a vertical asymptote for the graph of f if \( f (x) \) either increases or decreases without bound as x approaches a from the right or from the left. This is symbolically written as:


In general, the line \( y = b \) is a horizontal asymptote for the graph of \( f \) if \( f (x) \) approaches a constant \( b \) as \( x \) increases or decreases without bound.
case 1: For \( m \lt n \) , the horizontal asymptote is the line \( y = 0 \).
case 2: For \( m = n \) , the horizontal asymptote is the line \( y = a_m / b_n \)
case 3: For \( m \gt n \) , the graph has no horizontal asymptote.
b - Find the \( x \) and \( y \) intercepts of the graph of \( f \).
c - Find the vertical and horizontal asymptotes for the graph of \( f \) if there are any.
d - Use your answers to parts a, b and c above to sketch the graph of function \( f \).
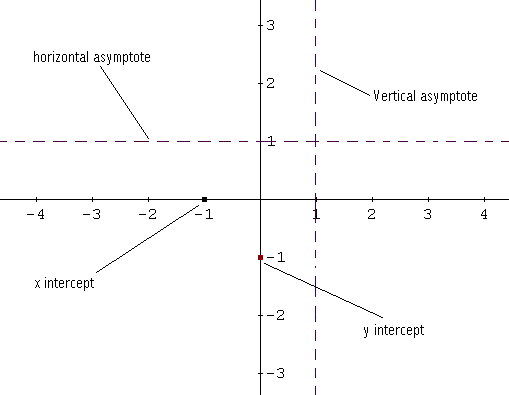
b - The \( x \) intercept is found by solving \( f (x) = 0 \) or \( x+1 = 0\). The x intercept is at the point \( (-1 , 0) \).
The \( y \) intercept is at the point \( (0 , f(0)) = (0 , -1) \).
c - The vertical asymptote is given by the zero of the denominator \( x = 1\).
The degree of the numerator is 1 and the degree of the denominator is 1. They are equal and according to the theorem above, the horizontal asymptote is the line \( y = 1 / 1 = 1 \).
d - Although parts a, b and c give some important information about the graph of \( f \), we still need to construct a sign table for function f in order to be able to sketch with ease.
The sign of \( f (x) \) changes at the zeros of the numerator and denominator. To find the sign table, we proceed as in solving rational inequalities. The zeros of the numerator and denominator which are -1 and 1 divides the real number line into 3 intervals: \[ (- \infty , -1) , (-1 , 1) , (1 , + \infty) \] We select a test value within each interval and find the sign of \( f (x) \).
In the interval \( (- \infty , -1) \) , select -2 and find \( f (-2) = ( -2 + 1) / (-2 - 1) = 1 / 3 \gt 0 \).
In \( (-1 , 1) \) , select 0 and find \( f(0) = -1 \lt 0 \).
In \( (1 , + \infty) \) , select 2 and find \( f (2) = ( 2 + 1) / (2 - 1) = 3 \gt 0 \).
Let us put all the information about function \( f \) in a table. \[ \begin{array}{|c|c|c|c|c|c|} \hline x & -\infty & -1 & & 1 & +\infty \\ \hline f(x) & + & 0 \ (\text{x-intercept}) & - & \text{V.A.} & + \\ \hline \end{array} \] In the table above V.A means vertical asymptote.
To sketch the graph of \( f \), we start by sketching the \( x \) and \( y \) intercepts and the vertical and horizontal asymptotes in broken lines. See sketch below.

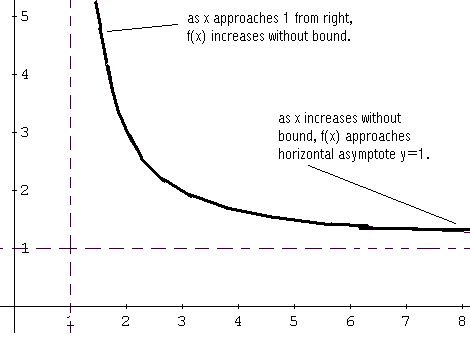
In the interval \( (-\infty , -1) \) , \( f (x) \) is positive hence the graph is above the \( x \) axis. Starting from left, we graph \( f \) taking into account the fact that \( y = 1 \) is a horizontal asymptote: The graph of \( f \) is close to this line on the left. See graph below.

Between -1 and 1 \( f (x) \) is negative, hence the graph of \( f \) is below the x axis. \( (0 , -1) \) is a y intercept and \( x =1 \) is a vertical asymptote: as x approaches 1 from left \( f (x) \) deceases without bound because \( f (x) \lt 0 \) in \( ( -1 , 1) \). See graph below.


b - Find the x and y intercepts of the graph of \( f \).
c - Find the vertical and horizontal asymptotes for the graph of \( f \) if there are any.
d - Use your answers to parts a, b and c above to sketch the graph of function \( f \).
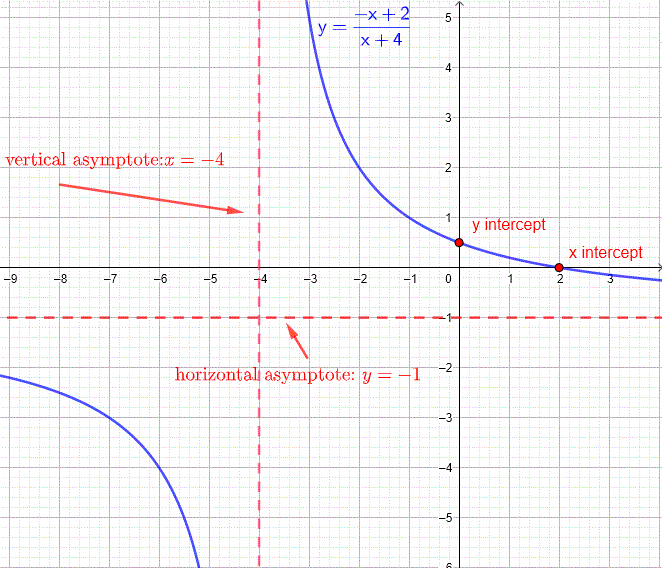
b) x intercept at \( (2 , 0) \) , y intercept at \( (0 , 1/2) \).
c) vertical asymptote: \( x = - 4 \) , horizontal asymptote: \( y = - 1 \).
d) The graph is shown below.
