How to Find x and y Intercepts Of Graphs?
How to find the x and the y intercepts of graphs of functions and equations?
The x and y intercepts of a graph are points of intersection of the graph with the x axis and the y axis respectively. This is a tutorial with examples and detailed solutions on how to find these points.
Example 1
Find the x and the y intercepts of the graph of function f defined by
\[ f(x) = - 3 x + 9 \]
Solution to Example 1
- A point on the x axis has y coordinate equal to 0, to find the x intercept, we set \( y = f(x) = 0 \) and solve for x
\[ f(x) = -3 x + 9 = 0 \]
- Solve for x.
\[ x = 3 \]
- The x intercept of the graph of \( f \) is:
x intercept: \[ (3 , 0) \]
- Since a point on the y axis has \( x \) coordinate equal to zero, to find the y interecpt, we set \( x \) to zero and find the y coordinate which is \( f(0) \).
\[ f(0) = -3(0) + 9 = 9 \]
y intercept: \[ (0 , 9) \]
Example 2
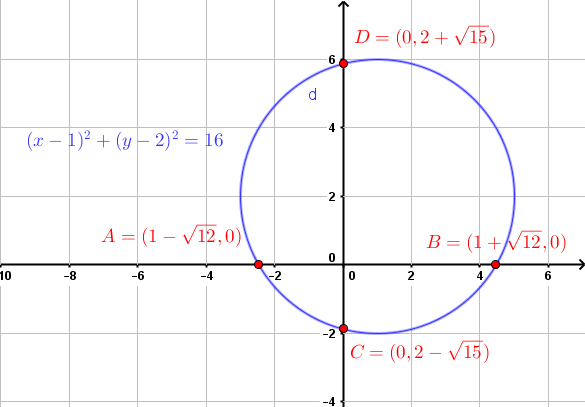
Find the x and the y intercepts of the graph of the circle given by the equation:
\[ (x - 1)^2 + (y - 2)^2 = 16 \]
Solution to Example 2
- To find y intercept: Set \( x = 0 \) in the given equation and solve for y.
\[ (0 - 1)^2 + (y - 2)^2 = 16 \]
- Solve for y
\[ 1 + (y - 2)^2 = 16 \]
\[ (y - 2)^2 = 15 \]
The solutions are: \[ y_1 = 2 + \sqrt{15} \quad \text{and} \quad y_2 = 2 - \sqrt{15} \]
- To find x intercept: set \( y = 0 \) in the given equation and solve for x
\[ (x - 1)^2 + (0 - 2)^2 = 16 \]
The solutions are: \[ x_1 = 1 + \sqrt{12} \quad \text{and} \quad x_2 = 1 - \sqrt{12} \]
- The x and y intercepts of the graph of the given equation are
x intercepts: \[ A = (1 - \sqrt{12} , 0) \quad \text{and} \quad B = (1 + \sqrt{12} , 0) \]
y intercepts: \[ C = (0 , 2 - \sqrt{15}) \quad \text{and} \quad D = (0 , 2 + \sqrt{15}) \]
- The graph shown below is that of the given equation. Examine the x and y intercepts and compare to those calculated. Note that the x and y intercepts may be determined graphically.
Example 3
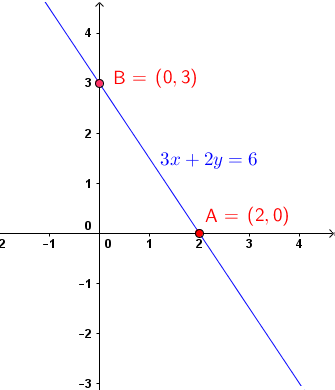
Calculate the x and the y intercepts of the graph of the linear equation given by
\[ 3x + 2y = 6 \]
Solution to Example 3
- x-intercept: set \( y = 0 \)
\[ 3 x + 2(0) = 6 \]
and solve for \( x \) to find the x-intercept.
\[ x = 2 \]
Hence the x intercepts is at: \[ A = (2 , 0) \]
- y-intercept: set \( x = 0 \) in the given equation and find the y intercept.
\[ 3(0) + 2y = 6 \]
- Solve for y
\[ y = 3 \]
Hece the y intercepts is at: \[ B = (0 , 3) \]
- The graph of the given equation is shown below. The x and y intercepts are those calculated above. Note that the x and y intercepts may be determined graphically.
Example 4
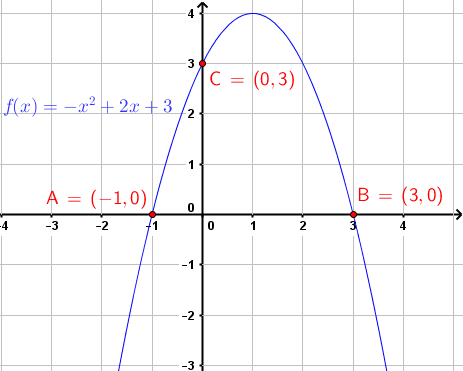
Calculate the \(x\)- and \(y\)-intercepts of the graph of the quadratic function given by
\( f(x) = -x^2 + 2x + 3 \)
Solution to Example 4
- To find the \(y\)-intercepts, Set \(x = 0\) in the formula of the given function to calculate the \(y\)-intercept, which is equal to \(f(0)\).
\[
y = f(0) = -0^2 + 2 \cdot 0 + 3 = 3
\]
- To find the \(x\)-intercepts, set \(y = f(x) = 0\) and solve for \(x\):
\[
-x^2 + 2x + 3 = 0
\]
Multiply both sides by \(-1\):
\[
x^2 - 2x - 3 = 0
\]
Solve using factoring:
\[
(x - 3)(x + 1) = 0
\]
\[
x_1 = -1 \quad \text{and} \quad x_2 = 3
\]
- The \(x\)- and \(y\)-intercepts of the graph of the function are:
\(x\)-intercepts: \(A = (-1, 0)\), \(B = (3, 0)\)
\(y\)-intercept: \(C = (0, 3)\)
- The graph of the given function is shown below along with the \(x\)- and \(y\)-intercepts as calculated above.
Example 5
Determine the \(x\) and the \(y\) intercepts of the graph of the logarithmic function given by
\[
f(x) = -\ln(x + 1) - 2
\]
Solution to Example 5
- y-intercept: Set \(x = 0\) in the formula of the function. The \(y\)-intercept is equal to \(f(0)\):
\[
y = f(0) = -\ln(0 + 1) - 2 = -2
\]
- x-intercept: Set \(y = f(x) = 0\) and solve for \(x\):
\[
-\ln(x + 1) - 2 = 0
\]
\[
\ln(x + 1) = -2
\]
\[
x + 1 = e^{-2}
\]
\[
\text{Solution: } x = -1 + \frac{1}{e^{2}}
\]
- The \(x\) and \(y\) intercepts of the graph of the function are:
\[
\text{\(x\)-intercept: } A = \left(-1 + \frac{1}{e^{2}},\, 0\right)
\]
\[
\text{\(y\)-intercept: } B = (0,\,-2)
\]
- The graph of the given function is shown below along with the \(x\) and \(y\) intercepts as calculated above.

Example 6
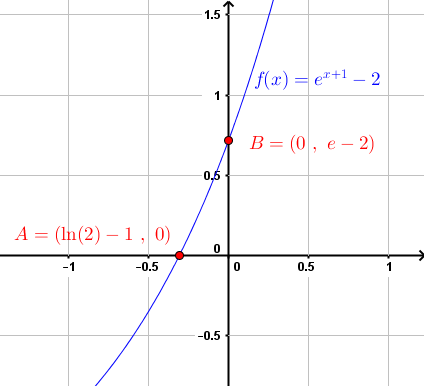
Calculate the \(x\) and the \(y\) intercepts of the graph of the exponential function given by:
\[
f(x) = e^{x + 1} - 2
\]
Solution to Example 6
- y-intercept: The \(y\)-intercept is equal to \(f(0)\).
\[
y = f(0) = e^{0 + 1} - 2 = e - 2
\]
- x-intercept: Set \(y = f(x) = 0\) and solve for \(x\):
\[
e^{x + 1} - 2 = 0
\]
\[
e^{x + 1} = 2
\]
\[
x + 1 = \ln 2
\]
\[
\text{Solution: } x = -1 + \ln 2
\]
- The \(x\) and \(y\) intercepts of the graph of the above equation are:
\[
\text{x-intercept: } A = (-1 + \ln 2, \ 0)
\]
\[
\text{y-intercept: } B = (0, \ e - 2)
\]
- The graph of the given function and its \(x\) and \(y\) intercepts are shown below.
Example 7
Calculate the x and the y intercepts of the graph of the rational function given by
\[ f(x) = \frac{x^2 - x - 2}{x^2 - x - 3} \]
Solution to Example 7
- y-intercept: The y-intercept is equal to \( f(0) \).
\[ y = f(0) = \frac{0^2 - 0 - 2}{0^2 - 0 - 3} = \frac{-2}{-3} = \frac{2}{3} \]
- x-intercepts: Set the numerator of \( f(x) \) equal to zero and solve for \( x \) to find the x-intercepts.
\[ x^2 - x - 2 = 0 \]
Solution: \( x_1 = -1 \) and \( x_2 = 2 \)
- The x- and y-intercepts of the graph of the above function are:
x-intercepts: \( A = (-1, 0) \), \( B = (2, 0) \)
y-intercept: \( C = \left(0, \frac{2}{3} \right) \)
- The graph of the given function and the x- and y-intercepts are shown below.

Example 8
Calculate the \( x \) and the \( y \) intercepts of the graph of the sine function given by
\[ f(x) = \sin(x) + \frac{1}{2} \]
Solution to Example 8
- y-intercept: The y-intercept is equal to \( f(0) \).
\[
y = f(0) = \sin(0) + \frac{1}{2} = \frac{1}{2}
\]
- x-intercepts: Set \( f(x) \) equal to zero and solve for \( x \) to find the x-intercepts.
\[
\sin(x) + \frac{1}{2} = 0 \quad \Rightarrow \quad \sin(x) = -\frac{1}{2}
\]
Because of the periodicity of the sine function, there is an infinite number of x-intercepts given by:
\[
x_1 = \frac{7\pi}{6} + 2k\pi, \quad k = 0, \pm1, \pm2, \ldots
\]
\[
x_2 = \frac{11\pi}{6} + 2k\pi, \quad k = 0, \pm1, \pm2, \ldots
\]
- Some of the x-intercepts are:
x-intercepts:
\[
A = \left(-\frac{\pi}{6}, 0\right), \quad B = \left(\frac{7\pi}{6}, 0\right), \quad C = \left(\frac{11\pi}{6}, 0\right)
\]
y-intercept:
\[
D = (0, \frac{1}{2})
\]
- The graph of the given function and the x- and y-intercepts are shown below.
