This tutorial explains how to solve inequalities involving two variables using graphical methods. Several examples are presented with detailed explanations and illustrations.
An inequality in two variables usually involves variables \(x\) and \(y\). An ordered pair \((a,b)\) is a solution if the inequality is true when \(x=a\) and \(y=b\). Since each ordered pair corresponds to a point in the coordinate plane, the solution set of an inequality is generally a region in the \(xy\)-plane.
If we replace the inequality symbol with an equal sign, we obtain the corresponding equation. The graph of this equation divides the plane into regions such that: either all points in a region satisfy the inequality, or none do. This idea is illustrated in the examples below.
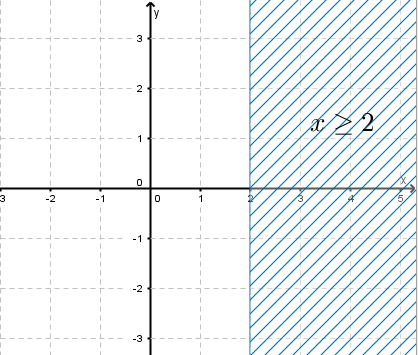
Problem. Solve graphically the inequality
\[ x \ge 2 \]To find the solution set:
Choose the point \((3,2)\), which lies to the right of the line \(x=2\). Substituting \(x=3\) into the inequality gives
\[ 3 \ge 2 \]which is true. Therefore, the solution set is the region to the right of the line \(x=2\), including the line itself. The line is drawn solid because the inequality includes equality.
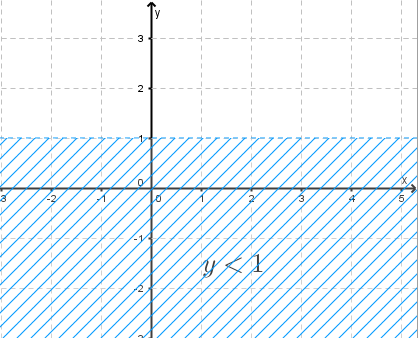
Problem. Solve graphically the inequality
\[ y < 1 \]This statement is true, so the solution set is the region below the line \(y=1\). Because the inequality is strict, the boundary line is drawn dashed.
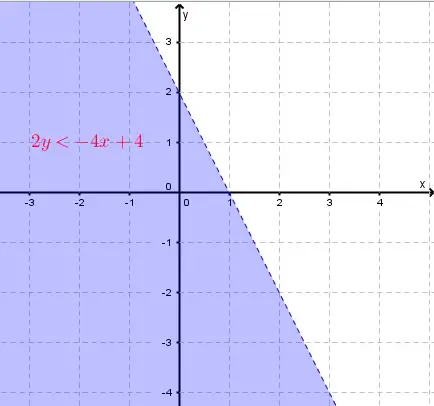
Problem. Solve graphically the inequality
\[ 2y < -4x + 4 \]The inequality is satisfied, so the solution set is the region containing the point \((0,0)\). The boundary line is dashed because the inequality is strict.
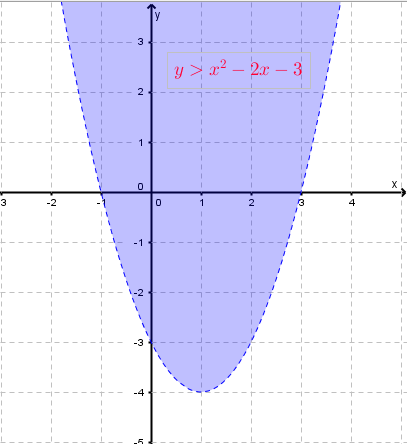
Problem. Solve graphically the inequality
\[ y > x^2 - 2x - 3 \]This statement is true, so the solution set is the region above the parabola. Since the inequality is strict, the parabola is drawn dashed.