Graphing arccos(x) functions
A step by step tutorial on graphing and sketching arccos(x) functions
and also the domain and range of these functions and other properties are discussed.
Graph, Domain and Range of arccos(x)
In what follows, \( \arccos(x) \) is the inverse function of \( f(x) = \ cos(x) \; \text{for} \; 0 \le x \le \pi \).
The domain of \( y = \arccos(x) \) is the range of \( f(x) = \ cos(x) \; \text{for} \; 0 \le x \le \pi \). and is given by the interval \( [-1 , 1] \).
The range of \( \arccos(x) \) is the domain of \( f \) which is given by the interval \( [0 , \pi] \).
The graph, domain and range of both \( f(x) = \ cos(x) \; \text{for} \; 0 \le x \le \pi \) and its inverse \( \arccos(x) \) are shown below.

A table of values of arccos(x) can made as follows:
\[
\begin{array}{|c|c|c|c|}
\hline
x & -1 & 0 & 1 \\
\hline
y = \arccos(x) & \pi & \frac{\pi}{2} & 0 \\
\hline
\end{array}
\]
Note that there are 3 key points that may be used to graph \( \arccos(x) \). These points are: \[ (-1 , \pi) , (0 , \dfrac{\pi}{2}) \; \text{and} \; (1,0) \].
Example 1
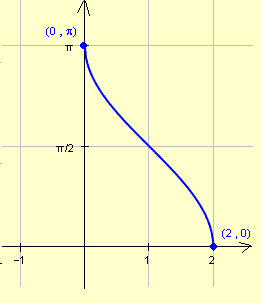
Find the domain and range of \( y = \arccos(x - 1) \) and graph it.
Solution to Example 1
The graph of \( y = \arccos(x - 1) \) will be that of \( \arccos(x) \) shifted \( 1 \) unit to the right.
The domain is found by stating that \[ -1 \le x - 1 \le 1 \].
Solve the double inequality to find the domain:
\[ 0 \le x \le 2 \]
The 3 key points of \( \arccos(x) \) can also be used in this situation as follows:
\[
\begin{array}{|c|c|c|c|}
\hline
x - 1 & -1 & 0 & 1 \\
\hline
y = \arccos(x - 1) & \pi & \frac{\pi}{2} & 0 \\
\hline
x & 0 & 1 & 2 \\
\hline
\end{array}
\]
The value of \( x \) is calculated from the value of \( x - 1\). For example when \( x - 1 = -1 \) , solve for x to find \( x = 0 \) and so on.
The domain is given by the interval \( [0,2] \) and the range is given by the interval \( [0,\pi] \)
The three points will now be used to graph \( y = \arccos(x - 1) \).

Example 2
Find the domain and range of \[ y = 2 arccos(x + 1) \] and graph it.
Solution to Example 2
We use the 3 key points in the table as follows, then find the value \( y = 2 arccos(x + 1) \) and \( x \).
\[
\begin{array}{|c|c|c|c|}
\hline
x + 1 & -1 & 0 & 1 \\
\hline
\arccos(x + 1) & \pi & \frac{\pi}{2} & 0 \\
\hline
y = 2\arccos(x + 1) & 2\pi & \pi & 0 \\
\hline
x & -2 & -1 & 0 \\
\hline
\end{array}
\]
domain is: \[ [-2,0] \]
range is: \[ [0 , 2 \pi] \]

The graph is that of \( \arccos(x) \) shifted one unit to the left and stretched vertically by a factor of \( 2 \).
Example 3
Find the domain and range of \[ y = - \arccos(x - 1) \] and graph it.
Solution to Example 3
We use the 3 key points in the table as follows, then find the value \( y = - \arccos(x - 1) \) and \( x \).
\[
\begin{array}{|c|c|c|c|}
\hline
x - 1 & -1 & 0 & 1 \\
\hline
\arccos(x - 1) & \pi & \dfrac{\pi}{2} & 0 \\
\hline
y = -\arccos(x - 1) & -\pi & -\dfrac{\pi}{2} & 0 \\
\hline
x & 0 & 1 & 2 \\
\hline
\end{array}
\]
domain is : \[ [0 , 2] \]
range is : \[ [- \pi , 0] \]

The graph is that of \( \arccos(x) \) shifted one unit to the right and reflected on the x axis.
More References and Links to Graphing
Graphing Functions


