Graphing by Translation, Scaling and Reflection
A step by step tutorial on the properties of transformations such as vertical and horizontal translation (or shift)
, scaling
and reflections on x-axis and y-axis
of graphs of functions is presented.
Translation / Shifting Horizontally
For any function \(f(x)\), if we replace \(x\) with \(x + c\), the graph of \(f(x + c)\) will be the graph of \(f(x)\) shifted horizontally by \(c\) units.
More specifically:
\[ f(x + c) \text{ is the graph of } f(x) \text{ shifted } c \text{ units to the left for } c \gt 0 \]
Or equivalently:
\[ f(x - c) \text{ is the graph of } f(x) \text{ shifted } c \text{ units to the right for } c \gt 0 \]
The example of the graph of f(x) = x2 and g(x) = (x - 2)2 are shown below and it is easily seen that the graph of (x - 2)2 is that of x2 shifted 2 units to the right.
The example of the graph of \( f(x) = x^2 \) and \( g(x) = (x - 2)^2 \) are shown below, and it is easily seen that the graph of \( (x - 2)^2 \) is that of \( x^2 \) shifted 2 units to the right.
\[
\begin{array}{c@{\hspace{4cm}}c}
\text{\( f(x) = x^2 \)} \quad & \quad \text{\( g(x) = (x - 2)^2 \)} \\
\end{array}
\]

If \( c \) is positive, then the graph is shifted to the left. The example of the graph of \( f(x) = \sqrt{x} \) and \( g(x) = \sqrt{x + 2} \) are shown below, and it is easily seen that the graph of \( \sqrt{x + 2} \) is that of \( \sqrt{x} \) shifted 2 units to the left.
\[
\begin{array}{c@{\hspace{4cm}}c}
\text{\( f(x) = \sqrt{x} \)} \quad & \quad \text{\( g(x) = \sqrt{x + 2} \)} \\
\end{array}
\]

Translation / Shifting Vertically
If we add a constant \( c \) to \( f(x) \), the graph of \( f(x) + c \) will be the graph of \( f(x) \) translated (or shifted) vertically. If \( c \) is positive, the graph is translated up. If \( c \) is negative , the graph is translated down; as shown in the graph below.
\[
\begin{array}{c@{\hspace{3cm}}c}
f(x) = x^2 \quad & \quad g(x) = x^2 + 2
\end{array}
\]

If \( c \) is negative, the graph is translated down as shown in the graph below.
\[
\begin{array}{c@{\hspace{3cm}}c}
f(x) = x^2 \quad & \quad g(x) = x^2 - 1
\end{array}
\]

Reflection on y-axis
Take any function f(x) and change x to - x, the graph of f(- x) will be the graph of f(x) reflected on the y axis.
\[
\begin{array}{c c}
f(x) = \sqrt{x} \quad & \quad g(x) = \sqrt{-x}
\end{array}
\]

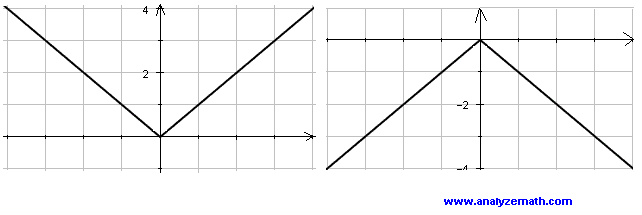
Reflection on x-axis
Take any function \( f(x) \) and it to \( - f(x) \), the graph of \( - f(x) \) will be the graph of \( f(x) \) reflected on the x axis.
\[
\begin{array}{c@{\hspace{3cm}}c}
f(x) = |x| \quad & \quad g(x) = -|x| \\
\end{array}
\]

Scaling Vertically
Take any function \( f(x)\), the graph of \( k f(x) \) (with \( k \gt 0 \)) will be the graph of \( f(x) \) expanded vertically if \( k \) is greater than \( 1 \) and compressed vertically if \( k \) is less than \( 1 \).
Graph in blue is that of f(x) = |x| and the graph in red is that of g(x) = 2 |x|

More References and Links to Graphing
Graphing Functions.


