|
This is an educational software that helps you explore concepts and mathematical objects by changing constants included in the expression of a function. The idea is to
introduce constants ( up to 10) a, b, c, d, f, g, h, i, j and k into expressions of functions and change them manually to see the effects graphically then explore.
example : f(x) = a*sin(b*x+c) + d , explore the effects of the constants a, b, c and d on the graph of f(x)?
How to use the software
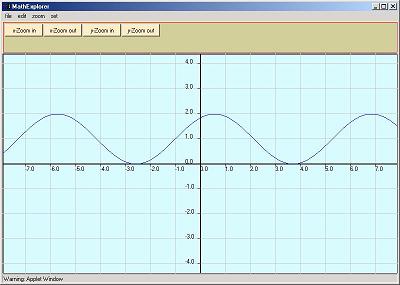
1 - click on the button above "click here to start" and wait till a new window similar to the
plot window below, pops up.
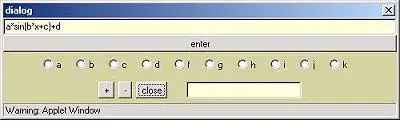
2 - click on "edit" in the main menu, and an input box, similar to the one below,pops up.
3 - input a mathematical expression, introduce constants a, b, c ... if you wish then click on "enter". The default value of each constant is 1, however they can be changed manually : check
the radio button of the constant included in the mathematical expression then press on the buttons + and - to increase or decrease the value of the constant. Repeat for all constants included in the expression.
NOTE
1 - you need the multiplication symbol * between any two quantities to be multiplied. For example 2x is not allowed,
you need to type 2*x.
2 - For a list of functions and contants that can be included in you expression click here
|