Graphical Approximation of Derivatives - Part(3)

Approximate graphically the first derivative of a function \( f \) from its graph. Each question is followed by a detailed, step-by-step solution explaining the reasoning to build a strong conceptual foundation in calculus.

Questions

  1. Question 1: Below is shown the graph of a function \( f \).

    a) Assuming that the only extrema of \( f \) are the ones shown on the graph, for which values of \( x \) is \( f'(x) = 0 \)?

    b) Assuming that the graph of \( f \) rises indefinitely to the left and to the right, determine the intervals where \( f'(x) < 0 \) and \( f'(x) > 0 \).
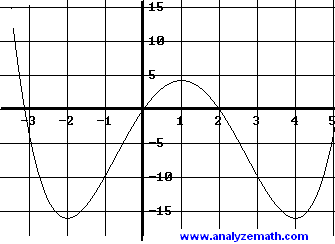
    Graph of function f for Question 1
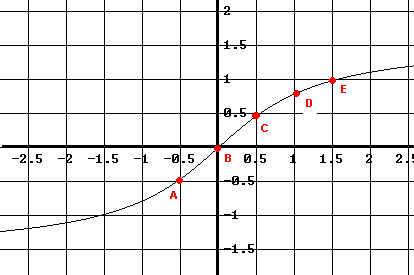
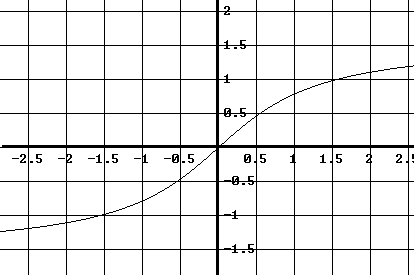
  2. Question 2: The graph of a function \( f \) is shown below. Assuming that \( f \) is an odd function and has horizontal asymptotes, approximate graphically the graph of its first derivative \( f'(x) \).
    Graph of function f for Question 2
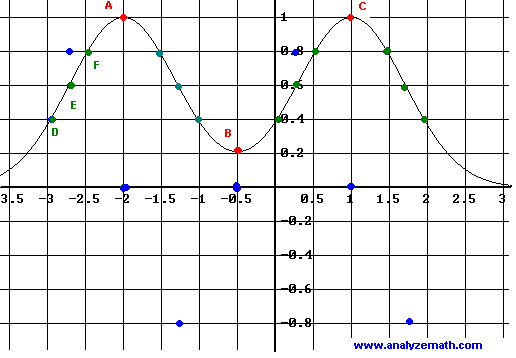
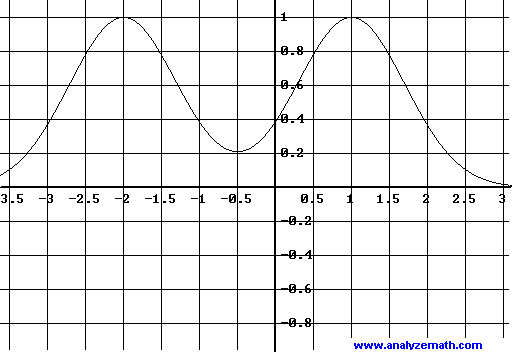
  3. Question 3: Approximate the graph of the first derivative \( f'(x) \) of the function \( f \) shown below. Assume that the graph of \( f \) is symmetric with respect to the vertical line \( x = -0.5 \) and that \( y = 0 \) is a horizontal asymptote.
    Graph of function f for Question 3

Step-by-Step Solutions with Explanations

Solution 1
  • a) The graph of \( f \) has two local minima at \[ x = -2 \quad \text{and} \quad x = 4 \] and one local maximum at \[ x = 1 . \] Therefore, \[ f'(x) = 0 \quad \text{for} \quad x = -2,\; 1,\; 4 . \]
  • b) The function \( f \) is decreasing on the intervals \[ (-\infty, -2) \quad \text{and} \quad (1, 4), \] so \[ f'(x) < 0 \quad \text{on these intervals.} \]
  • The function \( f \) is increasing on \[ (-2, 1) \quad \text{and} \quad (4, +\infty), \] hence \[ f'(x) > 0 \quad \text{on these intervals.} \]
Solution 2
  • The function \( f \) is increasing for all \( x \), so \[ f'(x) > 0 \quad \text{for all } x, \] and the graph of \( f'(x) \) lies above the \( x \)-axis.
  • The value \( f'(a) \) equals the slope of the tangent line to the graph of \( f \) at the point \( (a, f(a)) \). From the graph, the slope appears to be largest near the origin \( (0,0) \).
    Approximation of derivative near the origin
  • Using points \( A(x_A, y_A) \) and \( C(x_C, y_C) \) near the origin, \[ m_0 \approx \frac{y_C - y_A}{x_C - x_A} = \frac{0.5 - (-0.5)}{0.5 - (-0.5)} = 1 . \]
  • Using points \( C \) and \( E \), the slope near point \( D \) is approximated by \[ m_1 \approx \frac{1 - 0.5}{1.5 - 0.5} = 0.5 . \]
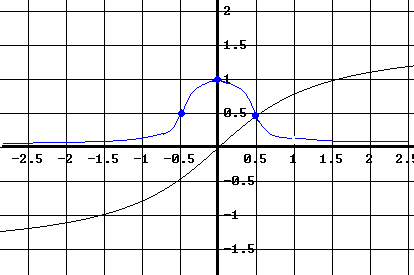
  • Since \( f \) has horizontal asymptotes, \[ \lim_{x \to \pm\infty} f'(x) = 0 . \]
  • Combining this information, a reasonable approximation of \( f'(x) \) is shown below in blue.
    Graph of derivative for Question 2
Solution 3
  • The derivative satisfies \[ f'(x) = 0 \quad \text{at} \quad x = -2,\; -0.5,\; 1, \] which correspond to the extrema of \( f \).
  • Using points \( D, E, F \), the slope at point \( E \) is approximated by \[ m_0 \approx \frac{0.8 - 0.4}{-2.4 - (-2.9)} = 0.8 . \]
  • Using the next group of three points to the right gives a slope close to \( -0.8 \). These values allow us to plot approximate points of \( f'(x) \).
    Approximate derivative points for Question 3
  • The derivative is positive where \( f \) is increasing: \[ (-\infty, -2) \quad \text{and} \quad (-0.5, 1). \]
  • The derivative is negative where \( f \) is decreasing: \[ (-2, -0.5) \quad \text{and} \quad (1, +\infty). \]
  • A possible approximation of \( f'(x) \) is shown below in blue:
    Final graph of derivative for Question 3

More Calculus Questions


All calculus questions with answers
Calculus tutorials and theory