Numerical, Graphical and Analytical Maths Problem Solving (1)
The problem of maximizing the area of a rectangular garden is examined using three approaches: numerical, graphical and analytical. A discussion to compare the three methods is also presented.
Problem:
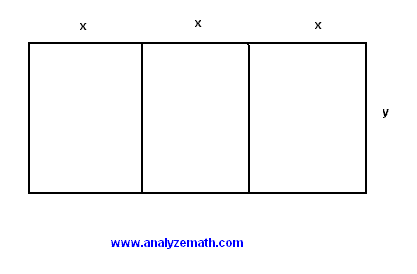
A farmer needs \( 150 \) meters of fencing to fence three adjacent gardens.
 .
.
- What is the relationship between \( x \) and \( y \)?
- Write the total area \( A \) of the three gardens as a function of \( x \).
- Find the domain of the function \( A(x) \).
- Complete the table of values shown below by calculating the area \( A \) given values of \(x\).
\[
\begin{array}{|c|c|}
\hline
x & A(x) \\ \hline
0 & \; \\ \hline
5 & \; \\ \hline
10 & \; \\ \hline
15 & \; \\ \hline
20 & \; \\ \hline
25 & \; \\ \hline
\end{array}
\]
- Use the table completed in part d) to approximate the value of \( x \) for which \( A(x) \) is maximum. You may need to generate more values.
- Graph \( A \) and approximate, from the graph obtained, the value of \( x \) for which \(A(x) \) is maximum.
- Find the vertex of the graph of \( A \) analytically and use it to find the exact value of \( x \) for which \( A(x) \) is maximum.
- Compare the values of \( x \) for which \( A(x) \) is maximum found in part e) numerically, f) graphically and part h) analytically.
- Compare the three methods.
Solution to Problem :
- Write the formula for the perimeter.
\[ 150 = 6 x + 4 y \]
- The total area is given by
\[ A = 3 x y \]
We solve \( 150 = 6 x + 4 y \) for \( y \).
\[ y = \dfrac{75 - 3 x}{2} \]
Substitute \( y \) by \( \dfrac{75 - 3 x}{2} \) in the formula for the area to obtain.
\[ A(x) = 3 x (75 - 3 x) / 2 \]
- To determine the domain of A we need to have x, which is a length, positive and also the area must be positive. Hence the two conditions
\[ x \gt 0 \text{ and } (75 - 3 x) \gt 0 \]
Solve the above inequalities to obtain the domain as the interval
\[ (0 , 25) \]
- Use the values of x in the formula of the area \( A(x) \) and complete the table.
\[
\begin{array}{|c|c|}
\hline
x & A(x) \\
\hline
0 & 0 \\
\hline
5 & 450 \\
\hline
10 & 675 \\
\hline
15 & 675 \\
\hline
20 & 450 \\
\hline
25 & 0 \\
\hline
\end{array}
\]
- Examining the above table, it seems that the maximum is somewhere between \( 10 \) and \( 15 \). Let us find some more values of \( A(x) \) for \( x \) between \( 10 \) and \( 15 \).
\[
\begin{array}{|c|c|}
\hline
x & A(x) \\ \hline
10 & 675 \\ \hline
11 & 693 \\ \hline
12 & 702 \\ \hline
13 & 702 \\ \hline
14 & 693 \\ \hline
15 & 675 \\ \hline
\end{array}
\]
The above values suggest that the value of \( x \) that makes \( A(x) \) maximum is somewhere between \( 12 \) and \( 13 \) and may be approximated by \( 12.5 \).
- The graph of \( A(x) \) is shown below.
 .
From the graph it seems that the value of \( x \) that makes A maximum is somewhere between \( 10 \) and \(15 \). It can be approximated by \( 12.5 \).
.
From the graph it seems that the value of \( x \) that makes A maximum is somewhere between \( 10 \) and \(15 \). It can be approximated by \( 12.5 \).
- \( A(x) \) is a quadratic function which may be written as
\[ A(x) = -(9 / 2) x^2 + (225 / 2) x \]
For a quadratic function of the form \( a x^2 + bx + c \), the vertex \( (h , k) \) of its graph is given by
\[ h = \dfrac{- b }{2 a} \]
When applied to \( A(x) \), \( h \) is given by
\[ h = - \dfrac{225/2}{2(-9/2)} = 12.5 \]
Since the leading coefficient of \( A(x) \) is negative, the vertex is a maximum point and therefore the exact value of \( x \) that makes A maximum is equal to \( h = 12.5 \)
- The numerical and graphical methods gave only approximations to the value of x that makes A maximum: around 12.5 however the analytical method gave the exact value of 12.5
-
- Using a computer, the numerical and graphical methods may be easily used to obtain an answer to the problem. However the analytical method needs some work to be done analytically.
- There are many problems that cannot be solved analytically. However numerical and graphical methods have a wider use in problem solving.
- Many of the analytical methods give the exact answer however numerical and graphical methods give approximate answers. The use of computers and calculators have made it possible to obtain answers with high precision.
More math problems with detailed solutions in this site.
Home Page