Free Mathematics Tutorials

Free Mathematics Tutorials

  • Home

Graphing Polar Equations

This is tutorial on graphing polar equations by hand, or sketching, to help you gain deep understanding of these equations. Several examples with detailed solutions are presented. Points in polar coordinates are represented by (R , t) where R is the polar distance and t is the polar angle. The method of point-by-point is used here. Free polar graph paper is available.

Examples on Graphing Polar Equations with Solution

Example 1

Graph the polar equation given by
R = 4 cos t
and identify the graph.

Solution to Example 1

  • We first construct a table of values using the special angles and their multiples. It is useful to first find values of t that makes R maximum, minimum or equal to zero. R is maximum and equal to 4 for t = 0. R is minimum and equal to -4 for t = π and R is equal to zero for t = π / 2.
     t  R
      0   4
      π / 6   3.5
      π / 4   2.8
      π / 3   2
      π / 2   0
      2 π / 3   -2
      3 π / 4   -2.8
      5 π / 6   -3.5
      π   -4

  • We stop the calculations at t = π because the values will repeat.
  • We now plot the above points on a system of polar coordinates. You need to understand the plotting of points in polar coordinates before you go any further. A system of polar coordinates with R = constant and t = constant is shown below. You need to pay special attention to points with a negative value of R.
    polar coordinates system with points plotted Pin it! Share on Facebook

  • We now join the points drawing a smooth curve.
    polar coordinates system with graph of polar equation Pin it! Share on Facebook


Example 2

Graph the polar equation given by
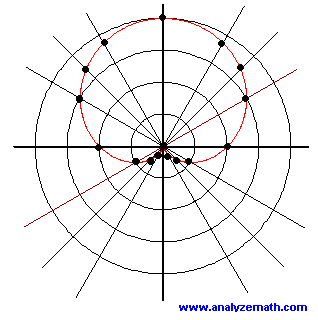
R = 2 + 2 sin t
and identify the graph.
Solution to Example 2
  • We first construct a table of values using the special angles and their multiples. R is maximum and equal to 4 for t = π / 2. R is minimum and equal to zero when t = 3 π / 2.
     t  R
      0   2
      π / 6   3.0
      π / 4   3.4
      π / 3   3.7
      π / 2   4
      2 π / 3   3.7
      3 π / 4   3.4
      5 π / 6   3
      π   2
     7 π / 6   1
      5 π / 4   0.6
      4 π / 3   0.3
      3 π / 2   0
      5 π / 3   0.3
      7 π / 4   0.6
      11 π / 6   1

  • We plot the points in the table then join them by a smooth curve. The points and the graph of the given polar equation are shown below.
    points and graph of the polar equation R = 2 + 2 sin t Pin it! Share on Facebook

Example 3

Graph the polar equation given by
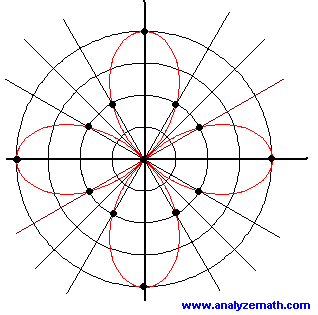
R = 4 cos 2t
and identify the graph.

Solution to Example 3

  • We first construct a table of values using the special angles and their multiples. R is maximum and equal to 4 for t = 0 and t = π. R is minimum and equal to -4 for t = π / 2 and 3 π / 2.
     t  R
      0   4
      π / 6   2
      π / 4   0
      π / 3   -2
      π / 2   -4
      2 π / 3   -2
      3 π / 4   0
      5 π / 6   2
      π   4
     7 π / 6   2
      5 π / 4   0
      4 π / 3   -2
      3 π / 2   -4
      5 π / 3   -2
      7 π / 4   0
      11 π / 6   2

  • We first plot the points in the table then join them by a smooth curve.
    points and graph of the polar equation R = 4 cos 2t Pin it! Share on Facebook

More References and Links to Polar Coordinates

Polar Coordinates.

More Info
  • Convert Equation from Polar to Rectangular Form
  • Download Free Graph Paper
  • Free Geometry Tutorials, Problems and Interactive Applets
  • Convert Polar to Rectangular Coordinates and Vice Versa
  • File Not Found

Quick Links

  • Top Menu

Follow Us

  • © 2022 analyzemath.com. All rights reserved.
  • Privacy Policy