A function from set \( D \) to set \( R \) is a relation that assigns to each element \( x \) in \( D \) exactly one element \( y \) of \( R \). The set \( D \) is the domain (inputs) and set \( R \) is the range (outputs).
Functions Represented by Venn Diagrams
Figures 1 and 2 show Venn diagrams representing functions because each input in \( D \) corresponds to exactly one output in \( R \).
Fig.1 - Function represented by Venn diagramFig.2 - Another function represented by Venn diagram
Note: Two different inputs (like 3 and 5) having the same output (0) does not violate the function definition.
Fig.3 - Not a function (input 6 has two outputs)
Functions Represented by Ordered Pairs
Question
Which relations represent functions?
\( R_1 = \{ (a,2), (b,4), (c,7), (d,-2) \} \)
\( R_2 = \{ (a,4), (a,5), (b,5), (c,5) \} \)
\( R_3 = \{ (0,4), (2,4), (4,5), (6,5) \} \)
Solution
All domain elements are different ⇒ \( R_1 \) is a function.
Input \( a \) has two different outputs ⇒ \( R_2 \) is not a function.
All domain elements are different ⇒ \( R_3 \) is a function.
Functions Represented by Graphs
Question
Explain why these relations are/aren't functions:
Fig.4: Not a function - input \( x = 2 \) has outputs 4 and 6.
Fig.4 - Not a function
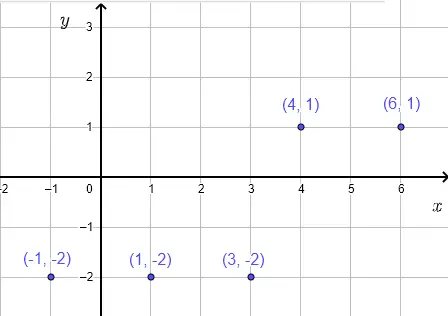
Fig.5: Is a function - each input has exactly one output.
Fig.5 - Is a function
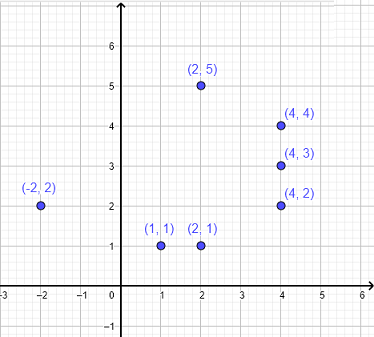
Fig.6: Not a function - multiple inputs have multiple outputs.
Fig.6 - Not a function
Functions Represented by Equations
Examples: \( y = 2x - 1 \), \( y = x^2 + 1 \), \( y = \dfrac{1}{x} \). All represent \( y \) as function of \( x \) because each \( x \) value produces exactly one \( y \) value. Here \( x \) is the independent variable and \( y \) the dependent variable.
The domain \( D \) is the set of all input values for which outputs are defined.
The range \( R \) is the set of all output values corresponding to inputs in \( D \).
Example
Find domain and range for these representations:
a) Ordered Pairs
\( F_1 = \{ (a,2), (b,4), (c,7), (d,-2) \} \)
Domain \( D = \{ a, b, c, d \} \)
Range \( R = \{ 2, 4, 7, -2 \} \)
b) Venn Diagram
Fig.7 - Function as Venn diagram
Domain \( D = \{ 0, 5, 3, -3 \} \)
Range \( R = \{ 2, 0, 6 \} \)
c) Graph
Fig.8 - Function as graph
Domain \( D = \{ 2, 4, 6, 7 \} \)
Range \( R = \{ 3, 1, 4, 2 \} \)
d) Equation
\( y = -x + 3 \) with \( D = \{-3, 0, 6, 7\} \)
Calculations:
\( x = -3 ⇒ y = 6 \)
\( x = 0 ⇒ y = 3 \)
\( x = 6 ⇒ y = -3 \)
\( x = 7 ⇒ y = -4 \)
Range \( R = \{ 6, 3, -3, -4 \} \)