Graphing and sketching sine functions of the form \[ f (x) = a \sin (bx + c) \] step by step tutorial is presented.
The properties such as domain, range and intercepts of the graphs of these functions are also looked at in detail.
Once you finish the present tutorial, you may want to go through a self test on trigonometric graphs. Free graph paper is available.
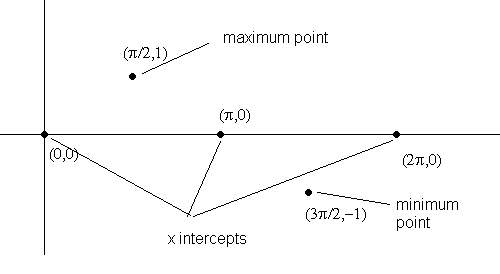
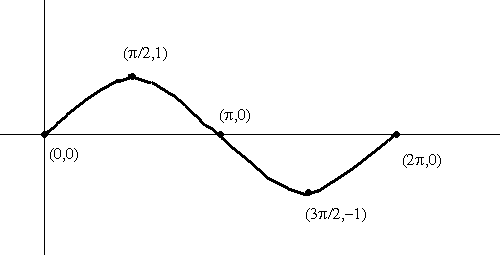
To graph \( f \), we first graph the points in the table then join these points. Of course you may add extra points if you wish.
But the five points used are key points. Another important point to note is that the 5 key points divide the period into 4 equal parts. See figures below.


If \( b > 0 \)
\[ 0 \leq x \leq \dfrac{2\pi}{b} \]Period \( = \dfrac{2\pi}{b} - 0 = \dfrac{2\pi}{b} \)
If \( b < 0 \) (change symbols of inequalities)
\[ 0 \geq x \geq \dfrac{2\pi}{b} \]Which is equivalent to
\[ \dfrac{2\pi}{b} \leq x \leq 0 \]Period \( = 0 - \dfrac{2\pi}{b} = -\dfrac{2\pi}{b} \)
Using the absolute value notation, we can write the period of \( f \) as
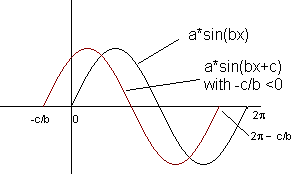
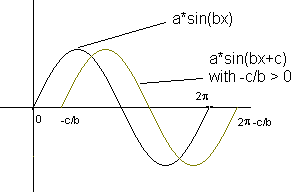
\[ \text{Period} = \dfrac{2\pi}{|b|} \]Let us now compare the cycle \([0 , \dfrac{2\pi}{b}]\) when \( c = 0 \) with the cycle \([ \dfrac{-c}{b} , \dfrac{2\pi - c}{b} ]\). This indicates that there is a shift of \( \dfrac{-c}{b} \). \[ \dfrac{-c}{b} \] is called the phase shift.
If \( \dfrac{-c}{b} \lt 0 \), the shift will be to the left.
If \( \dfrac{-c}{b} \gt 0 \), the shift will be to the right.


b - Find the period and the phase shift of the graph of f.
c - Sketch the graph of function f over one period.
The range is given by the interval \( [-2 , 2] \).
b - Period is: \[ \dfrac {2 \pi} {|b|} \] \[ = \dfrac {2 \pi} {3} \] Phase shift is : \[ - c / b = - (- \dfrac{\pi}{2}) / 3 \] \[= \dfrac{\pi}{6} \]
c - To sketch the graph of f over one period, we need to find the \( 5 \) key points first. Let \( 3x - \pi/2 \) vary from \( 0 to 2 \pi \) in order to have a complete period then find the values of \( f (x) \). See table below. \[ \begin{array}{|c|c|c|c|c|c|} \hline \textbf{\(3x - \dfrac{\pi}{2}\)} & 0 & \dfrac{\pi}{2} & \pi & \dfrac{3\pi}{2} & 2\pi \\ \hline \textbf{f(x)} & 0 & 2 & 0 & -2 & 0 \\ \hline \end{array} \]
We now need to find the corresponding values of \( x \). The first row in the table above gives \[ 0 \leq 3x - \dfrac{\pi}{2} \leq 2\pi \] Solve for \( x \) \[ \dfrac{\pi}{2} \leq 3x \leq 2\pi + \dfrac{\pi}{2} \] \[ \dfrac{\pi}{2} \leq 3x \leq \dfrac{5\pi}{2} \] \[ \dfrac{\pi}{6} \leq x \leq \dfrac{5\pi}{6} \] We now complete the table with the \( x \) values. Once the \( x \) values \( \dfrac{\pi}{6} \) and \( \dfrac{5\pi}{6} \), describing a whole period, are found, the other 3 points are found as follows:
The middle value is: \[ \left( \dfrac{\pi}{6} + \dfrac{5\pi}{6} \right) / 2 = \dfrac{3\pi}{6} \] Value at the first quarter: \[ \left( \dfrac{\pi}{6} + \dfrac{3\pi}{6} \right) / 2 = \dfrac{2\pi}{6} \] Value at the third quarter: \[ \left( \dfrac{3\pi}{6} + \dfrac{5\pi}{6} \right) / 2 = \dfrac{4\pi}{6} \] The fractions have not been reduced; this will make it easy to scale the \( x \)-axis in units of \( \dfrac{\pi}{6} \) and graph the points. \[ \begin{array}{|c|c|c|c|c|c|} \hline \textbf{3x - } \dfrac{\pi}{2} & 0 & \dfrac{\pi}{2} & \pi & \dfrac{3\pi}{2} & 2\pi \\ \hline f(x) & 0 & 2 & 0 & -2 & 0 \\ \hline x & \dfrac{\pi}{6} & \dfrac{2\pi}{6} & \dfrac{3\pi}{6} & \dfrac{4\pi}{6} & \dfrac{5\pi}{6} \\ \hline \end{array} \] We now draw the points given \( (x , f (x)) \) and join them by a smooth curve.

b - Find the period and the phase shift of the graph of f.
c - Sketch the graph of function f over one period.