This page presents a clear introduction to polar coordinates and polar equations, with detailed explanations, worked examples, and graphical illustrations.
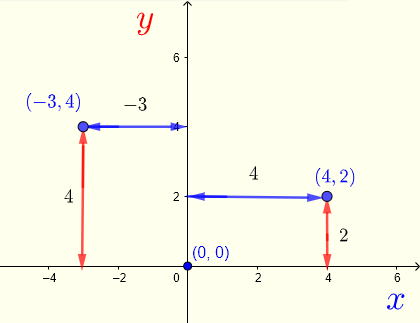
We begin by reviewing the Cartesian (rectangular) coordinate system. Let point \( A \) lie in the \( xy \)-plane. In Cartesian coordinates, the point \( A \) is represented by an ordered pair \( (x, y) \), where:
In the figure below, the points \( (x,y) = (4,2) \) and \( (x,y) = (-3,4) \) are shown.
In the polar coordinate system, a point is represented by the ordered pair \( (r, \theta) \), where:
The quantity \( r \) is called the radial coordinate, and \( \theta \) is the angular coordinate.
For example, the points \[ (5, \tfrac{\pi}{3}) \quad \text{and} \quad (4, \pi) \] are shown in the figure below.

By convention, the angle \( \theta \) is positive when measured counterclockwise and negative when measured clockwise.
Plot the points given by their polar coordinates:
a) \( (2,0) \) b) \( (2,\tfrac{3\pi}{4}) \) c) \( (4,\tfrac{7\pi}{3}) \) d) \( (3,-\tfrac{5\pi}{4}) \)
The points are plotted below.

Note: If the radial coordinate \( r \) remains the same and we add or subtract multiples of \( 2\pi \) to the angular coordinate, the same point is obtained.
That is, \[ (r,\theta), \quad (r,\theta + 2\pi), \quad (r,\theta - 4\pi), \dots \] all represent the same point.
The polar coordinate system allows the radial coordinate \( r \) to be negative. The points \[ (-r, \theta) \quad \text{and} \quad (r, \theta) \] lie on the same line through the pole and are the same distance \( |r| \) from the pole, but in opposite directions.
Thus, the coordinates \[ (-r, \theta) \quad \text{and} \quad (r, \theta + \pi) \] represent the same point.
Plot the following pairs of points:
a) \( (-2,0) \) and \( (2,0) \)
b) \( (-2,\tfrac{3\pi}{4}) \) and \( (2,\tfrac{3\pi}{4}) \)
c) \( (-4,-\tfrac{\pi}{3}) \) and \( (4,-\tfrac{\pi}{3}) \)

Unlike Cartesian coordinates, polar coordinates are not unique. A single point can be represented in infinitely many ways.
For integers \( n \) and \( k \), the coordinates \[ (r,\theta), \quad (r,\theta + 2n\pi), \quad (-r,\theta + (2k+1)\pi) \] all represent the same point.
Using trigonometry, the relationships between polar and Cartesian coordinates are:
\[ x = r\cos\theta, \qquad y = r\sin\theta \] \[ r^2 = x^2 + y^2, \qquad \theta = \arctan\!\left(\frac{y}{x}\right) \]
A polar equation has the form \( f(r,\theta) = 0 \). Its graph consists of all points \( (r,\theta) \) satisfying the equation.
Sketch the graph of the polar equation
\[ r - 3\sin\theta = 0 \]Solving for \( r \), we obtain:
\[ r = 3\sin\theta \]A table of values is shown below.
| \( \theta \) | \( r = 3\sin\theta \) |
|---|---|
| \( 0 \) | \( 0 \) |
| \( \tfrac{\pi}{6} \) | \( \tfrac{3}{2} \) |
| \( \tfrac{\pi}{4} \) | \( \tfrac{3}{\sqrt{2}} \) |
| \( \tfrac{\pi}{3} \) | \( \tfrac{3\sqrt{3}}{2} \) |
| \( \tfrac{\pi}{2} \) | \( 3 \) |
| \( \tfrac{2\pi}{3} \) | \( \tfrac{3\sqrt{3}}{2} \) |
| \( \tfrac{3\pi}{4} \) | \( \tfrac{3}{\sqrt{2}} \) |
| \( \tfrac{5\pi}{6} \) | \( \tfrac{3}{2} \) |
| \( \pi \) | \( 0 \) |

Converting to Cartesian coordinates:
\[ r - 3\sin\theta = 0 \] \[ r - 3\frac{y}{r} = 0 \] \[ r^2 - 3y = 0 \] \[ x^2 + y^2 - 3y = 0 \]Completing the square correctly:
\[ x^2 + (y - 1.5)^2 = (1.5)^2 \]This is a circle centered at \( (0, 1.5) \) with radius \( 1.5 \).