This tutorial explains how to identify the graph of an algebraic function given its formula. Several graphs are provided, but only one corresponds to the given function. Each example includes a detailed explanation to justify the correct choice.
Before starting, you may want to review basic concepts from the graphing functions tutorial.
Identify the graph of the function \[ f(x) = -x^2 - 1 \]

|

|

|

|
The function \( f(x) = -x^2 - 1 \) is a quadratic function, so its graph is a parabola. Writing the function in vertex form \[ f(x) = a(x - h)^2 + k \] helps identify its key features.
In this form, the vertex of the parabola has coordinates \( (h, k) \). If \( a > 0 \), the parabola opens upward, and if \( a < 0 \), it opens downward.
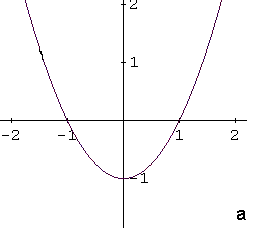
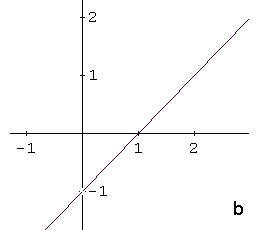
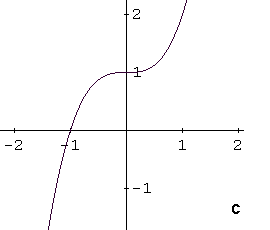
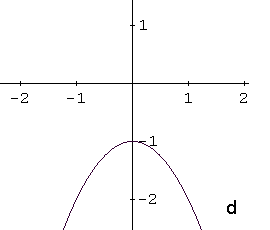
The given function can be rewritten as \[ f(x) = -(x - 0)^2 - 1 \] so the vertex is at \( (0, -1) \). Because the coefficient \( a = -1 \) is negative, the parabola opens downward. The y-intercept is also at \( (0, -1) \).
These properties match graph d, which is the correct answer.
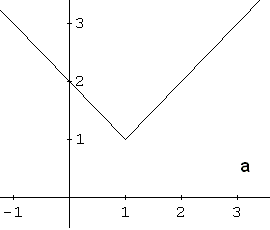
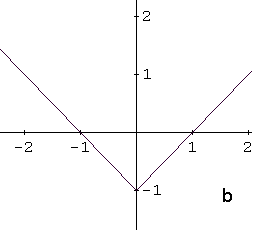
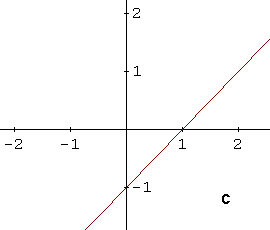
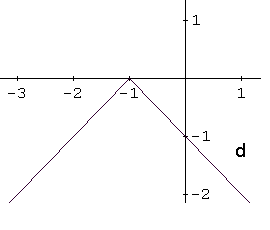
Identify the graph of the function \[ f(x) = |x - 1| + 1 \]
|
|
|
|
The function \( f(x) = |x - 1| + 1 \) is based on the absolute value function \( |x| \).
The graph of \( |x - 1| \) is obtained by shifting the graph of \( |x| \) one unit to the right:
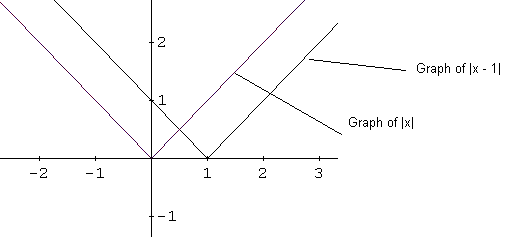
Adding \( +1 \) shifts the graph upward by one unit, giving the graph of \( |x - 1| + 1 \):
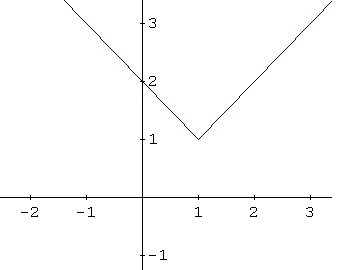
This transformed graph corresponds to graph a in Example 2.
You can now test your understanding by trying the self-test on graphs of functions, which contains similar identification problems.