Gaussian Function
Gaussian
functions of the form
\[ f(x) = a e^{-\frac{(x-b)^2}{c^2}} \]
and the properties of their graphs are explored.
Properties of the Graphs of Gaussian Functions
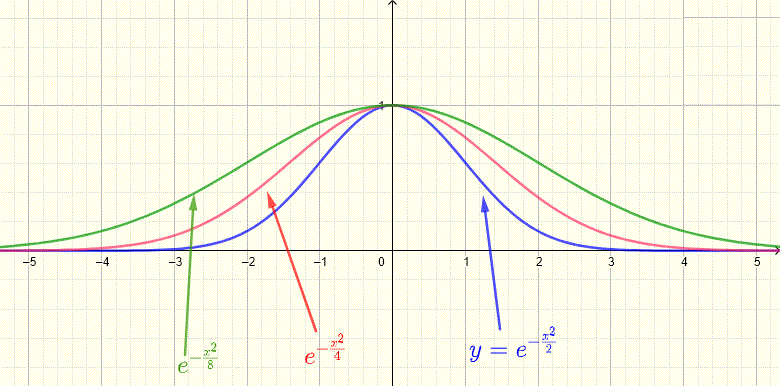
Below are shown gauusian function with \( a = 1 \), \( b = 0 \) and different values of \( c \). Note all functions of the form \( f(x) = e^{-\frac{x^2}{c^2}} \) have a maximum equal to \( 1 \) at \( x = 0 \). We also conclude that the parameter \( c \) controls the width of the graph of \( f \). As \( c \) get larger, the width of the graph gets larger.

Below are shown gauusian function with \( a = 1 \), \( c^2 = 2 \) and different values of \( b \). We also conclude that the parameter \( b \) controls the horizontal position (or shifting) of the graph. For \( b \) positive the graph is shifted to the right, and when \( b \) is negative, the graph is shifted to the left.

Gaussian Function as a Probability Density Function
The probability density function of a random variable that is normally distributed with mean \( \mu \) and variance \( \sigma^2 \), is given by Gauusian of the form.
\[ f(x) = \dfrac{1}{\sigma \sqrt{2\pi}} e^{-\frac{1}{2}\left(\frac{x-\mu}{\sigma} \right)^2} \]
and
\( \int_{-\infty}^{+\infty} \dfrac{1}{\sigma \sqrt{2\pi}} e^{-\frac{1}{2}\left(\frac{x-\mu}{\sigma} \right)^2} dx = 1 \)
Interactive Tutorial to Further Explore Gaussian Functions
Change parameters \( a \), \( b \) and \( c \) in the function
\[ f(x) = a e^{-\frac{(x-b)^2}{c^2}} \]
following the activities below and explain.
1 - click on the button above "draw" to start. The graph of the gaussian function is displayed.
2 - Use the sliders to set parameters b to 0 and c to 1 and change parameter a. What happens to the graph?
3 - Now set parameters a to 1 and c to 1 and change parameter b. What happens to the graph? Explain analytically.
4 - Set parameters a to 1 and b to 0 and change parameter c. What happens to the graph when c takes small values? What happens to the graph when c takes larger values?
Answers to the Above Questions
2 - The graph expands vertically as a increases. The y values of the points making the graph are multiplied by the value of a.
3 - As b increases, the graph is shifted to the right. As b decreases the graph is shifted to the left.
4 - As c is made small, the graph shrinks horizontally. As c is made large, the graph expands horizontally.
More References and Links
Applications, Graphs, Domain and Range of Functions

