The Use of Graphing Software in the Mathematics Classroom (4)

Paper presented by Dr. A. Dendane at the 11th Annual Research Conference - UAE University, April 2010

3.5 Mathematical Modeling and Problem Solving

Problem: Find a function \( S \) that gives the number of squares needed to complete the pattern shown below for \( n \) rows.

Pattern visualization

Task: Students use Autograph to plot the points \((n, S(n))\) and find the best fit. As an extension to this work, students are asked to find \( S \) as a function of \( n \) analytically.

Best fit problem visualization

Fig. 6: Best fit problem.

Students work in groups during this activity and use the best fit feature of Autograph to find an equation whose graph passes through all four points. This serves as an intuitive introduction to curve fitting. The second part of the activity, where students must find an analytical solution, may be assigned as homework.
3.6 Explore the Concept of Periodicity

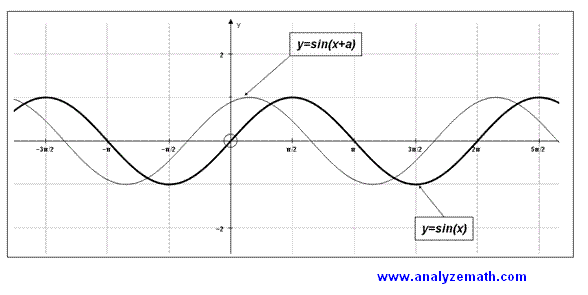
Task: Students find the smallest positive value of the constant \( a \), starting from \( a = 0 \), so that the graphs of \( \sin(x) \) and \( \sin(x + a) \) are identical.

Periodicity of sine function

Fig. 7: Periodicity of sine function.

Students work individually on this activity, which helps them grasp the graphical meaning of periodicity and phase shifts.

Research Paper Series (Parts 1 - 5)

Navigate through the parts of this research paper:

1 | 2 | 3 | [ 4 ] | 5