What is the Central Limit Theorem?[1]
The Central Limit Theorem (CLT) is a fundamental statistical principle stating that when sufficiently large random samples are taken from any population with mean \( \mu \) and standard deviation \( \sigma \), the sampling distribution of the sample means will approximate a normal distribution with:
\[ \mu_{\bar{X}} = \mu \]
\[ \sigma_{\bar{X}} = \frac{\sigma}{\sqrt{n}} \]
The value \( \sigma_{\bar{X}} \) is called the standard error of the mean. This approximation improves as sample size \( n \) increases, typically becoming very good when \( n \ge 30 \).
Key Facts About the CLT:
- No population distribution assumption: The CLT holds regardless of the population's distribution shape.
- Large sample guideline: While \( n \ge 30 \) is a common guideline, larger samples may be needed for highly skewed distributions.
- Normal populations: If the population is normally distributed, the sampling distribution of means is normal for any sample size \( n \).
- Binomial distributions: For binomial populations with probability of success \( p \), the sample proportion approximates normality when both \( np \ge 5 \) and \( n(1-p) \ge 5 \).
- Independence: Samples must be independent (usually achieved through random sampling).
Understanding Sampling Distributions: A Concrete Example
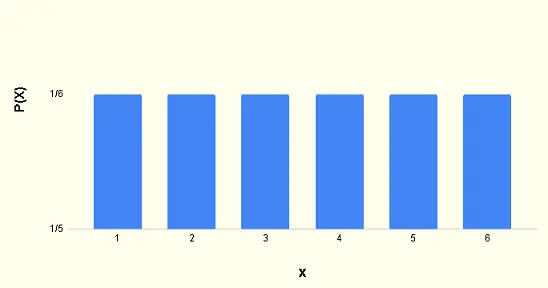
Let's examine a simple uniform distribution to illustrate the CLT in action. Consider a population consisting of the integers 1 through 6 (like a fair die):
Population Parameters:
For this discrete uniform distribution:
\[ \mu = \frac{1+2+3+4+5+6}{6} = 3.5 \]
\[ \sigma^2 = \frac{\sum_{i=1}^{6} (x_i - \mu)^2}{6} = \frac{(1-3.5)^2 + (2-3.5)^2 + \cdots + (6-3.5)^2}{6} = \frac{35}{12} \approx 2.9167 \]
\[ \sigma = \sqrt{\frac{35}{12}} \approx 1.7078 \]
Sampling Distribution for \( n = 2 \):
Consider all possible samples of size \( n = 2 \) (with replacement):
| 1,1 | 1,2 | 1,3 | 1,4 | 1,5 | 1,6 |
| 2,1 | 2,2 | 2,3 | 2,4 | 2,5 | 2,6 |
| 3,1 | 3,2 | 3,3 | 3,4 | 3,5 | 3,6 |
| 4,1 | 4,2 | 4,3 | 4,4 | 4,5 | 4,6 |
| 5,1 | 5,2 | 5,3 | 5,4 | 5,5 | 5,6 |
| 6,1 | 6,2 | 6,3 | 6,4 | 6,5 | 6,6 |
Calculate sample means \( \bar{X} = \frac{x_1 + x_2}{2} \):
| 1.0 | 1.5 | 2.0 | 2.5 | 3.0 | 3.5 |
| 1.5 | 2.0 | 2.5 | 3.0 | 3.5 | 4.0 |
| 2.0 | 2.5 | 3.0 | 3.5 | 4.0 | 4.5 |
| 2.5 | 3.0 | 3.5 | 4.0 | 4.5 | 5.0 |
| 3.0 | 3.5 | 4.0 | 4.5 | 5.0 | 5.5 |
| 3.5 | 4.0 | 4.5 | 5.0 | 5.5 | 6.0 |
Sampling Distribution of \( \bar{X} \):
| \( \bar{X} \) | 1.0 | 1.5 | 2.0 | 2.5 | 3.0 | 3.5 | 4.0 | 4.5 | 5.0 | 5.5 | 6.0 |
|---|
| \( P(\bar{X}) \) | 1/36 | 2/36 | 3/36 | 4/36 | 5/36 | 6/36 | 5/36 | 4/36 | 3/36 | 2/36 | 1/36 |
|---|
Parameters of the Sampling Distribution:
Mean of sampling distribution:
\[ \mu_{\bar{X}} = \sum \bar{X}_i P(\bar{X}_i) = 3.5 = \mu \]
Standard error (theoretical):
\[ \sigma_{\bar{X}} = \frac{\sigma}{\sqrt{n}} = \frac{1.7078}{\sqrt{2}} = \sqrt{\frac{35}{24}} \approx 1.2076 \]
Standard error (from discrete distribution):
\[ \sigma_{\bar{X}} = \sqrt{\sum (\bar{X}_i - \mu_{\bar{X}})^2 P(\bar{X}_i)} \approx 1.215 \]
Note: The theoretical value (1.2076) closely matches the calculated value (1.215), demonstrating that even for small \( n = 2 \), the formula \( \sigma_{\bar{X}} = \sigma/\sqrt{n} \) provides a good approximation.
Central Limit Theorem: Practice Problems & Step-by-Step Solutions
Example 1: Basic Sample Mean Probability
A population has mean \( \mu = 20 \) and standard deviation \( \sigma = 4 \). A random sample of 64 observations is selected. What is the approximate probability that the sample mean is less than 19?
Solution
Sample size \( n = 64 \ge 30 \), so CLT applies:
\[ \mu_{\bar{X}} = \mu = 20 \]
\[ \sigma_{\bar{X}} = \frac{\sigma}{\sqrt{n}} = \frac{4}{\sqrt{64}} = 0.5 \]
Calculate Z-score for \( \bar{X} = 19 \):
\[ Z = \frac{\bar{X} - \mu_{\bar{X}}}{\sigma_{\bar{X}}} = \frac{19 - 20}{0.5} = -2 \]
Using standard normal distribution:
\[ P(\bar{X} < 19) = P(Z < -2) \approx 0.0228 \]
Interpretation: There's approximately a 2.28% chance that a random sample of 64 observations from this population will have a sample mean less than 19.
Example 2: Investment Portfolio Returns
A group of 251 investing companies had an average return of 4.5% with standard deviation 1.5% during a specific period. If 40 companies are randomly selected, what is the probability that their average return is between 4% and 5%?
Solution
CLT applies since \( n = 40 \ge 30 \):
\[ \mu_{\bar{X}} = 4.5\% \]
\[ \sigma_{\bar{X}} = \frac{\sigma}{\sqrt{n}} = \frac{1.5\%}{\sqrt{40}} \approx 0.2372\% \]
Calculate Z-scores for both boundaries:
\[ Z_1 = \frac{4\% - 4.5\%}{0.2372\%} \approx -2.108 \]
\[ Z_2 = \frac{5\% - 4.5\%}{0.2372\%} \approx 2.108 \]
Probability between boundaries:
\[ P(4\% < \bar{X} < 5\%) = P(-2.108 < Z < 2.108) \approx 0.965 \]
Interpretation: There's approximately a 96.5% chance that a random sample of 40 companies will have an average return between 4% and 5%.
Example 3: Mutual Fund Performance
A large group of mutual funds had an average 5-year return of 80% with standard deviation 30%. If 50 funds are randomly selected, what is the probability that their average return exceeds 90%?
Solution
CLT applies since \( n = 50 \ge 30 \):
\[ \mu_{\bar{X}} = 80\% \]
\[ \sigma_{\bar{X}} = \frac{\sigma}{\sqrt{n}} = \frac{30\%}{\sqrt{50}} \approx 4.2426\% \]
Calculate Z-score for \( \bar{X} = 90\% \):
\[ Z = \frac{90\% - 80\%}{4.2426\%} \approx 2.357 \]
Right-tail probability:
\[ P(\bar{X} > 90\%) = P(Z > 2.357) \approx 0.0092 \]
Interpretation: There's approximately a 0.92% chance that a random sample of 50 mutual funds will have an average return exceeding 90%.
Example 4: Manufacturing Quality Control
A factory produces tools with average length 10 cm and standard deviation 0.3 cm. If 200 tools are randomly sampled, what is the probability that the sample mean length is within 0.05 cm of the population mean?
Solution
CLT applies since \( n = 200 \ge 30 \):
\[ \mu_{\bar{X}} = 10 \text{ cm} \]
\[ \sigma_{\bar{X}} = \frac{\sigma}{\sqrt{n}} = \frac{0.3}{\sqrt{200}} \approx 0.0212 \text{ cm} \]
Calculate Z-scores for boundaries \( 9.95 \) cm and \( 10.05 \) cm:
\[ Z_1 = \frac{9.95 - 10}{0.0212} \approx -2.358 \]
\[ Z_2 = \frac{10.05 - 10}{0.0212} \approx 2.358 \]
Probability within tolerance:
\[ P(9.95 < \bar{X} < 10.05) = P(-2.358 < Z < 2.358) \approx 0.9816 \]
Interpretation: There's approximately a 98.2% chance that a random sample of 200 tools will have a mean length between 9.95 cm and 10.05 cm.
Example 5: Airline Weight Limit Problem
An airplane with 200 seats has a total baggage limit of 6000 kg. Passenger baggage weight follows a distribution with mean 28 kg and standard deviation 15 kg. What is the probability that the total baggage weight of 200 passengers does not exceed the limit?
Solution
Convert to a sample mean problem. The average weight must not exceed:
\[ \text{Maximum average} = \frac{6000}{200} = 30 \text{ kg} \]
CLT applies since \( n = 200 \ge 30 \):
\[ \mu_{\bar{X}} = 28 \text{ kg} \]
\[ \sigma_{\bar{X}} = \frac{\sigma}{\sqrt{n}} = \frac{15}{\sqrt{200}} \approx 1.0607 \text{ kg} \]
Calculate Z-score for \( \bar{X} = 30 \) kg:
\[ Z = \frac{30 - 28}{1.0607} \approx 1.886 \]
Left-tail probability:
\[ P(\bar{X} \le 30) = P(Z \le 1.886) \approx 0.9703 \]
Interpretation: There's approximately a 97.0% chance that the total baggage weight of 200 randomly selected passengers will not exceed 6000 kg.
Continuity Correction Note:
When working with discrete data (like counts or proportions) and using the normal approximation, a continuity correction of ±0.5 can improve accuracy. However, for sample means of continuous variables (as in most examples above), no continuity correction is needed.