Graphs of Exponential Functions
Graphing and sketching exponential functions: step by step tutorial. The properties such as domain, range, horizontal asymptotes and intercepts of the graphs of these functions are also examined in details. Free graph paper is available.
Review
We first start with the properties of the graph of the basic
exponential function defined by:
of base a,
\[ f (x) = a^x , \; a \ge 0 \; \text{and} \; a \ne 1. \]
The domain of function \( f \) is the set of all real numbers. The range of \( f \) is the interval \( (0 , +\infty) \).
The graph of \( f \) has a horizontal asymptote given by \( y = 0\). Function \( f \) has a y intercept at \( (0 , 1) \).
The exponential function \( f \) is an increasing function if \( a \gt 1 \) and a decreasing function if \( a \lt 1 \).
Example 1
Function \( f \) is given by
\[
f (x) = 2^{x - 2}
\]
- Find the domain and range of \( f \).
- Find the horizontal asymptote of the graph.
- Find the x and y intercepts of the graph of \( f \) if there are any.
- Sketch the graph of \( f \).
Answer to Example 1
-
The domain of \( f \) is the set of all real numbers.
To find the range of \( f \),we start with
\[
2^x \gt 0
\]
Multiply both sides by \( 2^{-2}\) (a positive number).
\[ 2^x 2^{-2} \gt 0\]
Use exponential properties to rewrite the above as
\[ 2^{x-2} \gt 0 \]
This last inequality suggests that \( f(x) \gt 0\). Hence the range of \( f \) is given by the interval:
\[ (0, +\infty)\]
-
As \( x \) decreases (- infinity ) without bound,
\( f(x) = 2^{x-2} \) approaches \( 0 \). Hence the graph of \( f \) has a horizontal asymptote at \( y = 0 \).
-
To find the x intercept we need to solve the equation
\[
f(x) = 0 \]
substitute
\[ 2^{x-2} = 0 \]
Since \( f(x) \gt 0 \) the above equation does not have a solution. The graph of \( f \) does not have an x intercept.
The y - intercept is given by:
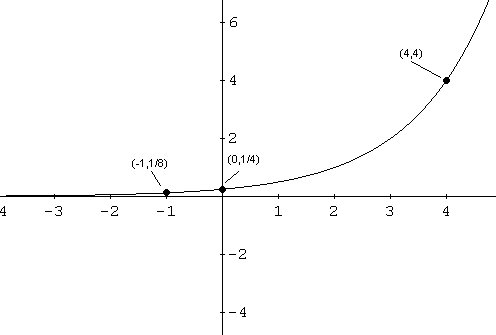
\[ (0 , f(0)) = (0, 2^{0-2} = (0 , 1/4) \]
- So far we have the domain, range, y intercept and the horizontal asymptote. We need extra points.
\[ (4 , f(4)) = (4, 2^{4-2} = (4 , 2^2 = (4 , 4) \]
\[ (-1 , f(-2)) = (-1, 2^{-1-2}) = (-1 , 2^{-3}) = (-1 , 1/8) \]
Let us now use all the above information to graph f.

Matched Problem to Example1:
Function \( f \) given by
\[
f (x) = 2^{x + 2}
\]
- Find the domain and range of \( f \).
- Find the horizontal asymptote of the graph.
- Find the x and y intercepts of the graph of \( f \) if there are any.
- Sketch the graph of \( f \).
Example 2
f is a function given by
\[
f (x) = 3^{x+1} - 2
\]
Answer to Example 2
-
The domain of \( f \) is the set of all real numbers.
To find the range of \( f \), we start with
\[ 3^x \gt 0 \]
Multiply both sides by \( 3 \) which is positive.
\[ 3 \cdot 3^x \gt 3 \cdot 0 \]
Use exponential properties and simplify the right side to rewrite the above as
\[ 3^{x+1} \gt 0 \]
Subtract 2 to both sides
\[ 3^{x+1} -2 \gt -2 \]
This last statement suggests that \( f(x) \gt -2 \). The range of \( f \) is
\[ (-2, +\infty ) \]
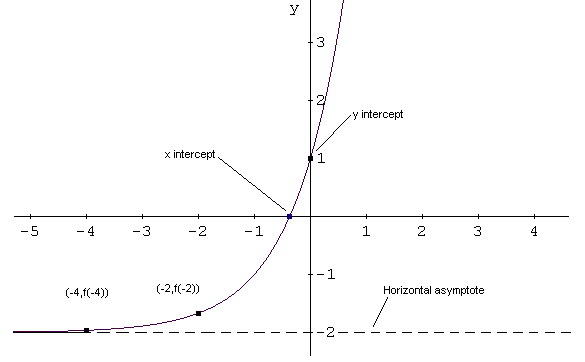
- As x decreases without bound to \( -\infty\) the expression \( 3^{x+1} \) approaches zero and \( f(x) = 3^{x+1} -2 \) approaches \( -2 \). The graph of f has a horizontal asymptote \( y = -2 \).
- To find the x intercept we need to solve the equation \( f(x) = 0 \) which gives:
\[ 3^{x+1} - 2 = 0 \]
Add \( 2 \) to both sides of the equation and simplify
\[ 3^{x+1} = 2 \]
Rewrite the above equation in Logarithmic form
\[ x +1 = \log_3 (2 ) \]
Solve for x
\[ x = \log_3 (2 ) - 1 \]
The y intercept is given by
\[ (0 , f(0)) = (0,3^{0+1} - 2) = (0 , 1) \]
-
So far we have the domain, range, x and y intercepts and the horizontal asymptote. We need extra points.
\[ (-2 , f(-2)) = (-2, 3^{-2+1} - 2) = (4 , \dfrac{1}{3}-2) \approx (4 , -1.67) \]
\[ -4 , f(-4)) = (-4, 3^{-4+1} - 2) = (-4 , 2^{-3}) \approx (-4 , -1.99) \]
Let us now use all the above information to graph \( f \).

Matched Problem to Example2:
Function \( f \) given by
\[ f (x) = 2^{x - 2} + 1 \]
-
Find the domain and range of \( f \).
-
Find the horizontal asymptote of the graph of \( f \).
-
Find the x and y intercepts of the graph of \( f \) if there are any.
-
Sketch the graph of \( f \).
More References and Links to Exponential Functions and Graphing

