Graphing Cubic Functions
A step by step tutorial on how to determine the properties of the graph of cubic functions and graph them. Properties, of these functions, such as domain, range, x and y intercepts, zeros and factorization are used to graph this type of functions. Free graph paper is available.
Properties of Cubic Functions
Cubic functions have the form
\[ f (x) = a x^3 + b x^2 + c x + d \]
Where \( a, b, c \) and \( d \) are real numbers and \( a \) is not equal to 0.
The domain of this function is the set of all real numbers. The range of this funstion is the set of all real numbers.
The y- intercept of the graph of \( f \) is given by \( y = f(0) = d \).
The x- intercepts are found by solving the equation
\[ a x^3 + b x^2 + c x + d = 0 \]
The left hand side behaviour of the graph of the cubic function is as follows:
If the leading coefficient a is positive, as \( x \) increases \( f(x) \) increases (graph up) and as \( x \) decreases indefinitely \( f(x) \) decreases (graph down).
If the leading coefficient a is negative as \( x \) increases \( f(x) \) decreases (graph down) and as \( x \) decreases indefinitely \( f(x) \) increases (graph up).
Example 1
\( f \) is a cubic function given by
\[
f (x) = x^3
\]
- Find the x and y intercepts of the graph of \( f \) .
- Find the domain and range of \( f \) .
- Sketch the graph of \( f \) .
Solution to Example 1
- a - The y intercept is given by
\[ (0 , f(0)) = (0 , 0) \]
- The x coordinates of the x intercepts are the solutions to
\[ x^3 = 0 \]
- The x intercept are at the points \( (0 , 0) \).
- b - The domain of \( f \) is the set of all real numbers.
- Since the leading coefficient of \( x^3 \) is positive, the graph of f is up on the right and down on the left and hence the range of \( f \) is the set of all real numbers.
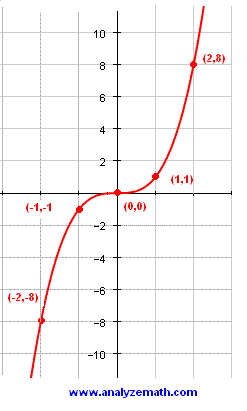
- c - make a table of values and graph.
\[
\begin{array}{|c|c|c|c|c|c|}
\hline
\mathbf{x} & -2 & -1 & 0 & 1 & 2 \\
\hline
\mathbf{f(x) = x^3} & -8 & -1 & 0 & 1 & 8 \\
\hline
\end{array}
\]
Note that since \( f(-x) = (-x)^3 = - x^3 = - f(x) \), function \( f \) is odd and its graph is symmetric with respect to the origin \( (0,0) \).

Example 2
\( f \) is a cubic function given by
\[
f (x) = - (x - 2)^3
\]
- Find y intercepts of the graph of \( f \).
- Find all zeros of \( f \) and their multiplicity.
- Find the domain and range of \( f \).
- Use the y intercept, x intercepts and other properties of the graph of to sketch the graph of \( f \).
Solution to Example 2
- a - The y intercept is given by
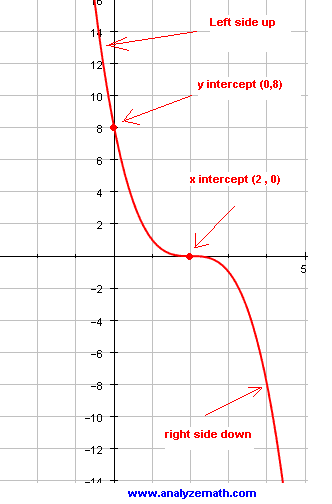
\[ (0 , f(0)) = (0 , 8) \]
- b - The zeros of f are solutions to
\[ - (x - 2)^3 = 0 \]
- Function \( f \) has one zero at \( x = 2 \) of multiplicity \( 3 \) and therefore the graph of \( f \) cuts the x axis at \( x = 2 \).
- c - The domain of \( f \) is the set of all real numbers.
- Expand \( f(x) \),
\[
f (x) = - (x - 2)^3 = - x^3 + 6 x^2 - 12 x + 8
\]
Wer can see that the leading coefficient of \( x^3 \) is negative, the graph of \( f \) is down on the right and up on the left and hence the range of \( f \) is the set of all real numbers.
- d - Properties and graph.
The graph cuts the x axis at \( x = 2\). The y intercept \( (0,-8) \) is a point where the grapg of \( f \) cuts the y-axis.
Also the graph of \( f(x) = - (x - 2)^3 \) is that of \( y = x^3 \) shifted \( 2 \) units to the right because of the term \( (x - 2) \) and reflected on the x axis because of the negative sign in \( f(x) = - (x - 2)^3 \).
Putting all these properties the left and right hand behavior of the graph of \( f \), we have the follwoing graph.

Example 3
\( f \) is a cubic function given by
\[
f (x) = x^3 + 2 x^2 - x - 2
\]
- Factor f(x).
- Find all zeros of \( f \) and their multiplicity.
- Find the domain and range of \( f\).
- Use the y intercept, x intercepts and other properties of the graph of to sketch the graph of \( f\).
Solution to Example 3
-
a - Fcator \( f(x) \): \[ f(x) = x^3 + 2x^2 - x - 2
= x^2(x + 2) - (x + 2) = (x + 2)(x^2 - 1) \]
\]
-
b - The zeros of \( f \) are solutions to
\[
(x + 2)(x^2 - 1) = (x + 2)(x - 1)(x + 1) = 0
\]
-
Function \( f \) has zeros at \( x = -2 \), \( x = 1 \), and \( x = -1 \).
Therefore, the graph of \( f \) cuts the x-axis at all these x-intercepts.
-
c - The domain of \( f(x) \) is the set of all real numbers.
-
d - The leading coefficient of \( f(x) \) is positive;
the graph of \( f \) is down on the left and up on the right.
Hence, the range of \( f \) is the set of all real numbers.
-
Properties and graph:
The y-intercept of the graph of \( f \) is at \( 0, (f(0)) = (0, -2) \).
The graph cuts the x-axis at \( x = -2 \), \( -1 \), and \( 1 \).
Adding to all these properties the left and right-hand behavior of the graph of \( f \), we have the following graph.

Example 4
\( f \) is a cubic function given by
\[
f (x) = - x^3 + 3 x + 2
\]
- Show that \( (x - 2) \) is a factor of \( f(x) \) and factor \( f(x) \) completely.
- Find all zeros of \( f \) and their multiplicity.
- Find the domain and range of \( f \).
- Use the y intercept, x intercepts and other properties of the graph of \( f \) to sketch it.
Solution to Example 4
- a - The division of \( f(x) \) by \( x - 2 \) gives a quotient equal to \( -x^2 - 2x - 1 \) and a remainder equal to 0. Hence,
\[
f(x) = (x - 2)(-x^2 - 2x - 1)
\]
Fcator \( x^2 + 2x + 1 \) and substitute
\[
f(x) = - (x - 2)(x^2 + 2x + 1) = -(x - 2)(x + 1)^2
\]
- b - The zeros of \( f \) are solutions to
\[
-(x - 2)(x + 1)^2 = 0
\]
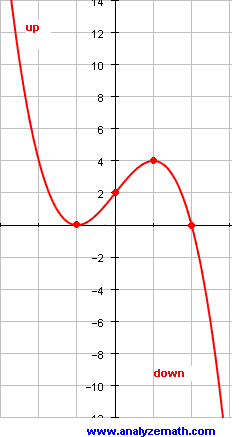
Function \( f \) has zeros at \( x = 2 \) and \( x = -1 \) with multiplicity 2. Therefore, the graph of \( f \) cuts the \( x \)-axis at \( x = 2 \) and is tangent to the \( x \)-axis at \( x = -1 \) because the multiplicity of this zero is even.
- c - The domain of \( f(x) \) is the set of all real numbers.
The leading coefficient of \( f(x) \) is negative. The graph of \( f \) goes up on the left and down on the right. Hence, the range of \( f \) is the set of all real numbers.
- d - Properties and graph:
The \( y \)-intercept of the graph of \( f \) is at \( (0, 2) \). The graph cuts the \( x \)-axis at \( x = 2 \) and is tangent to it at \( x = -1 \). Considering the end behavior and these intercepts, we have the following graph.

More References and Links to Graphing
Graphing Functions.


