Graph Piecewise Functions

A step by step tutorial on graphing and sketching piecewise functions. The graph, domain and range of these functions and other properties are examined. Free graph paper is available.


Definition of Piecewise Functions

A piecewise function is usually defined by more than one formula: a fomula for each interval.

Example 1:

f( x ) = - x         if x <= 2

         = x         if x > 2

What the above says is that if x is smaller than or equal to 2, the formula for the function is f( x ) = -x and if x is greater than 2, the formula is f( x ) = x. It is also important to note that the domain of function f defined above is the set of all the real numbers since f is defined everywhere for all real numbers.

Example 2:

f( x ) = 2         if x > -3

         = -5         if x < -3

The above function is constant and equal to 2 if x is greater than -3. function f is also constant and equal to -5 if x is less than -3. It can be said that function f is piecewise constant. The domain of f given above is the set of all real numbers except -3: if x = -3 function f is undefined.

Example 3:

Functions involving absolute value are also a good example of piecewise functions.

f( x ) = | x |

Using the definition of the absolute value, function f given above can be written

f( x ) = x         if x >= 0

         = -x         if x < 0

The domain of the above function is the set of all real numbers.

Example 4:

Another example involving absolute vaule.

f( x ) = | x + 6 |

The above function may be written as

f( x ) = x + 6         if x >= -6

         = - (x + 6)         if x < -6

The above function is defined for all real numbers.

Example 5:

Another example involving more than two intervals.

f( x ) = x 2 - 3         if x <= -10

         = - 2x + 1         if -10 < x <= -2

         = - x 3         if 2 < x < 4

        = ln x         if x > 4

The above function is defined for all real numbers except for values of x in the interval (-2 , 2] and x = 4.

Example 6: f is a function defined by

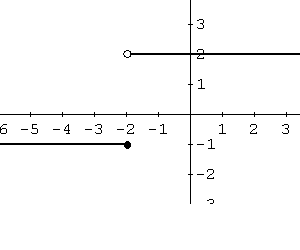
f( x ) = -1         if x <= -2

         = 2         if x > -2

Find the domain and range of function f and graph it.

Solution to Example 6:

Function f is defined for all real values of x. The domain of f is the set of all real numbers. We will graph it by considering the value of the function in each interval.

In the interval (- inf , -2] the graph of f is a horizontal line y = f(x) = -1 (see formula for this interval above). Also this interval is closed at x = -2 and therefore the graph must show this : see the "closed point" on the graph at x = -2.

In the interval (-2 , + inf) the graph is a horizontal line y = f(x) = 2 (see formula for this interval above). The interval (-2 , + inf) is open at x = -2 and the graph shows this with an "open point". Function f can take only two values: -1 and 2. The range is given by {-1, 2}


graph of function in example 6

Example 7: f is a function defined by

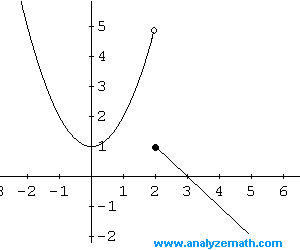
f( x ) = x 2 + 1         if x < 2

         = - x + 3         if x >= 2

Find the domain and range of function f and graph it.

Solution to Example 7:

The domain of f is the set of all real numbers since function f is defined for all real values of x.

In the interval (- inf , 2) the graph of f is a parabola shifted up 1 unit. Also this interval is open at x = 2 and therefore the graph shows an "open point" on the graph at x = 2.

In the interval [2 , + inf) the graph is a line with an x intercept at (3 , 0) and passes through the point (2 , 1). The interval [2 , + inf) is closed at x = 2 and the graph shows a "closed point". From the graph, we can observe that function f can take all real values. The range is given by (- inf, + inf).


graph of function in example 7

Example 8: f is a function defined by

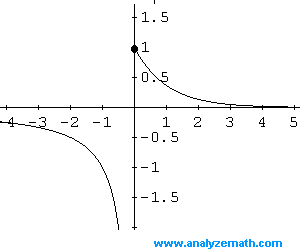
f( x ) = 1 / x         if x < 0

         = e -x         if x >= 0

Find the domain and range of function f and graph it.

Solution to Example 8:

The domain of f is the set of all real numbers since function f is defined for all real values of x.

In the interval (- inf , 0) the graph of f is a hyperbola with vertical asymptote at x = 0.

In the interval [0 , + inf) the graph is a decreasing exponential and passes through the point (0 , 1). The interval [0 , + inf) is closed at x = 0 and the graph shows a "closed point".

As x becomes very small, 1 / x approaches zero. As x becomes very large, e -x also approaches zero. Hence the line y = 0 is a horizontal asymptote to the graph of f.


From the graph of f shown below, we can observe that function f can take all real values on (- inf , 0) U (0 , 1] which is the range of function f.

graph of function in example 8

Example 9: f is a function defined by

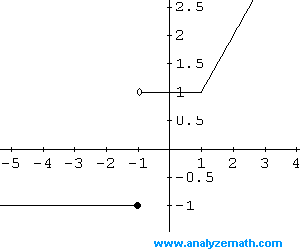
f( x ) = -1         if x <= -1

         = 1         if -1 < x <= 1

         = x         if x > 1

Find the domain and range of function f and graph it.

Solution to Example 9:

The domain of f is the set of all real numbers.

In the interval (- inf , -1], the graph of f is a horizontal line y = f(x) = -1. Closed point at x = -1 since interval closed at x = -1.

In the interval (-1 , 1] the graph is a horizontal line. There should a closed point at x = 1 but read below.

In the interval (1 , + inf) the graph is the line y = x. There should an open point at x = 1 since the interval is open at x = 1. But a closed point (see above) and an open point at the same location becomes a "normal" point.


From the graph of f shown below, we can observe that function f can take all real values on {-1} U [1 , + inf) which is the range of function f.

graph of function in example 9

More references and links on graphing.
Graphing Functions